. 2007 Mar;55(3):303-11.
doi: 10.1016/j.lungcan.2006.10.019. Epub 2006 Nov 21.

Increased expression and activity of repair genes TDP1 and XPF in non-small cell lung cancer

Affiliations

Increased expression and activity of repair genes TDP1 and XPF in non-small cell lung cancer

Chunyan Liu et al. Lung Cancer. 2007 Mar.

Abstract

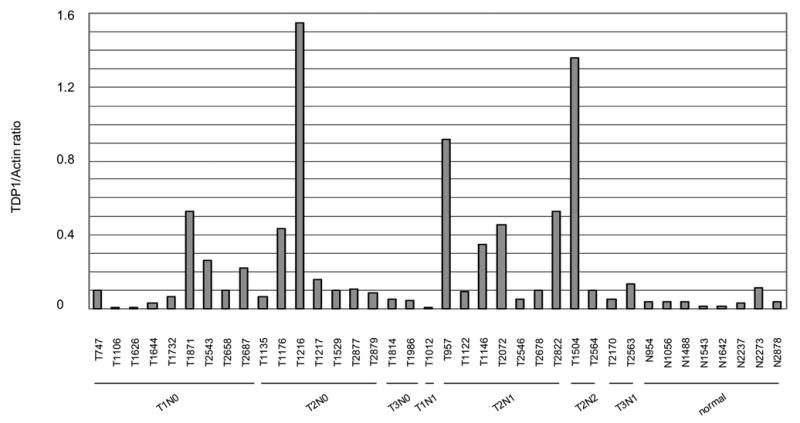
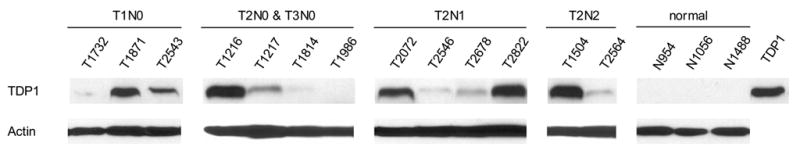
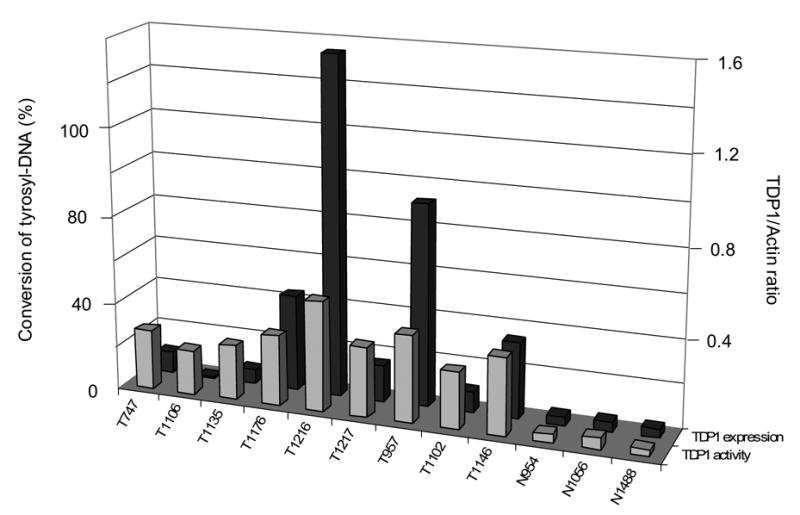
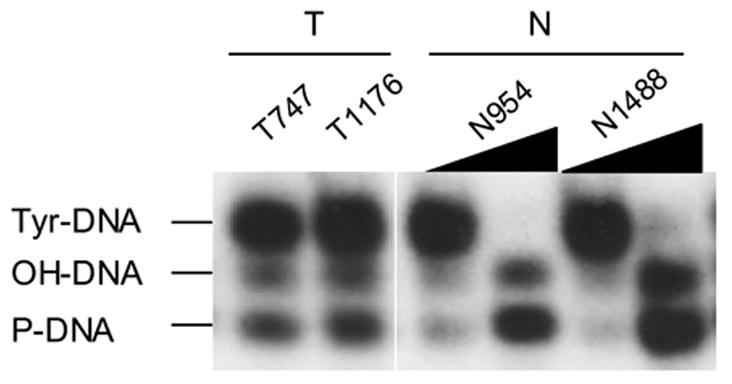
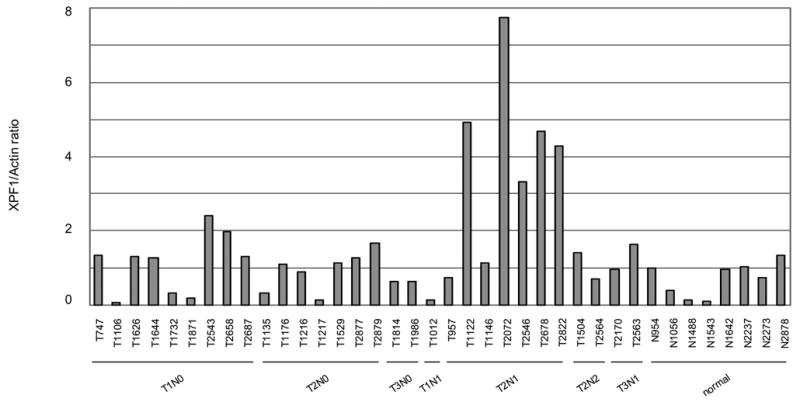
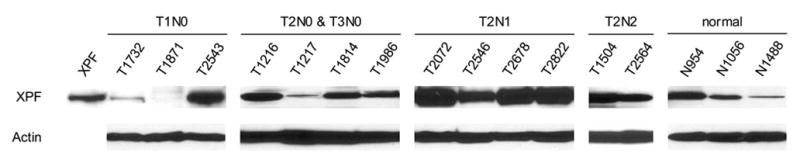
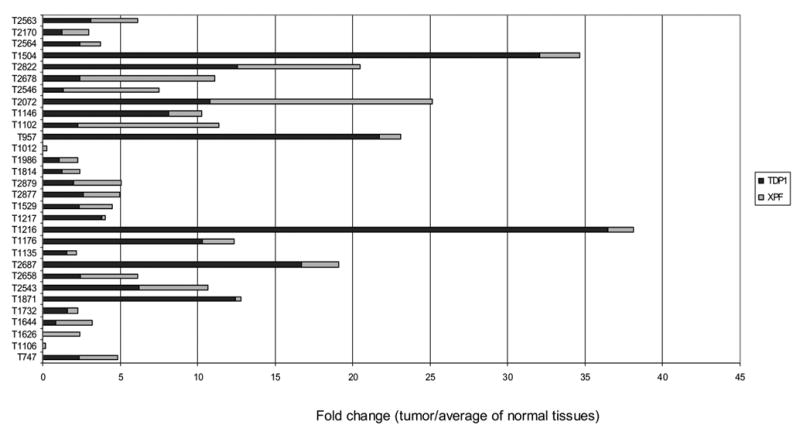
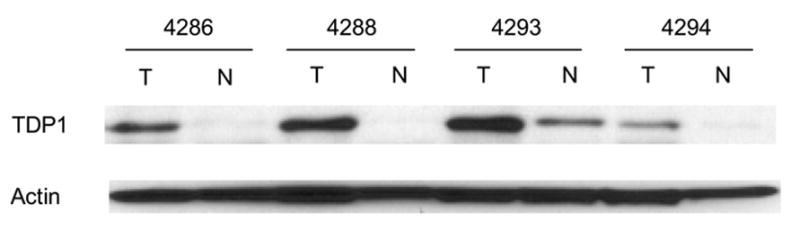
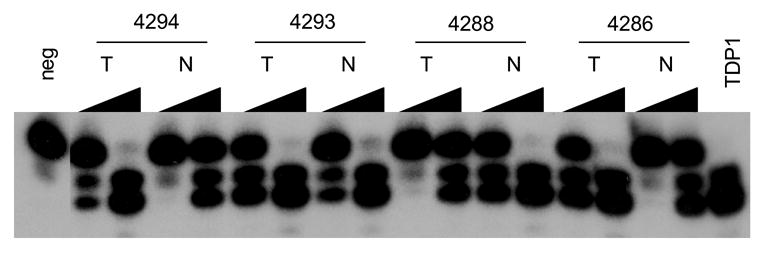
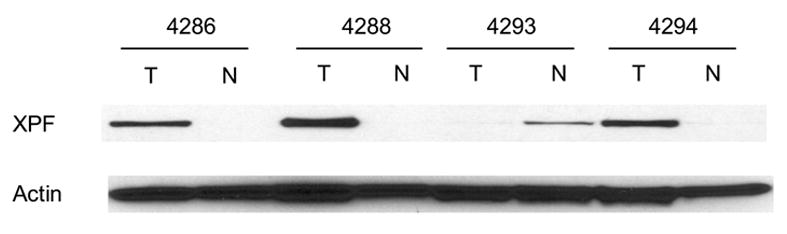
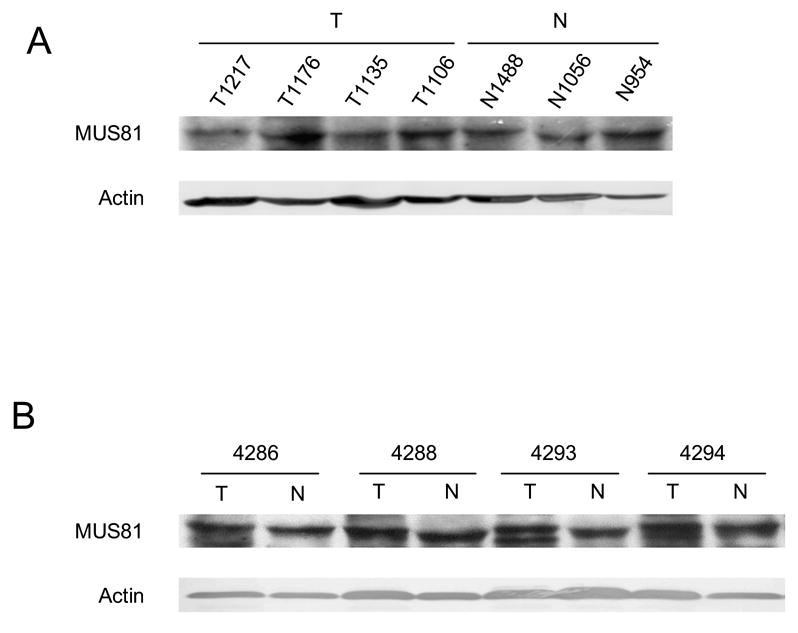
Resistance to camptothecin (CPT), a topoisomerase I (Top1) inhibitor, is frequently encountered in non-small cell lung cancer (NSCLC) and CPT resistance is linked with TDP1, an enzyme capable of cleaving the covalent linkage between stabilized Top1 with DNA. The aim of this study is to evaluate the in vivo expression level of TDP1, as well as parallel repair pathway components XPF and MUS81, in primary NSCLC. We collected 30 un-matched and 4 NSCLC samples matched with normal lung tissue and 8 samples of non-neoplastic lung tissue from patients with and without lung cancer, and determined the protein expression of these three genes using Western blot and TDP1 activity by a specific enzymatic assay. Both TDP1 and XPF were overexpressed in over 50% of NSCLC tissues, with wide ranges of expression levels. MUS81 did not exhibit alteration in expression. Overexpression of TDP1 and XPF is common in NSCLC, and is therefore of interest as a possible contributor to drug resistance in NSCLC.


Conflict of interest statement

Conflict of interest statement

None declared

Figures

Figure 1
Figure 1
Expression and activity of TDP1 was increased in un-matched NSCLC. A: Quantitative analysis of the protein expression levels of TDP1 of thirty un-matched NSCLC versus eight non-neoplastic tissues, normalized with their expression of β-actin using ImageJ. The samples were run on different gels, and the blotting variations between gels were adjusted using the ratio of TDP1/Actin of N954 that was loaded on every gel. B: Western blotting of representative samples as shown in A. All samples were loaded with 32 μg of tissue extract. C: Quantification of TDP1 enzymatic activity of nine tumor samples versus three non-neoplastic tissues and the comparison with their protein expression levels. All samples were assayed with 80 ng of tissue extract. D: Electrophoresis of the reaction products of TDP1 enzymatic assay on a sequencing gel. The samples were representatives of C. Tumor samples were assayed with 80 ng of tissue extract, and non-neoplastic tissues were assayed with 80 ng and 4 μg of extract. The upper bands were the 18 mer Tyr-DNA substrate; the lower ones converted hydroxyl- and phosphoryl-DNA, respectively. A–D: N, non-neoplastic tissue; T, tumor. The lab ID number was used to name each sample.
Figure 1
Figure 1
Expression and activity of TDP1 was increased in un-matched NSCLC. A: Quantitative analysis of the protein expression levels of TDP1 of thirty un-matched NSCLC versus eight non-neoplastic tissues, normalized with their expression of β-actin using ImageJ. The samples were run on different gels, and the blotting variations between gels were adjusted using the ratio of TDP1/Actin of N954 that was loaded on every gel. B: Western blotting of representative samples as shown in A. All samples were loaded with 32 μg of tissue extract. C: Quantification of TDP1 enzymatic activity of nine tumor samples versus three non-neoplastic tissues and the comparison with their protein expression levels. All samples were assayed with 80 ng of tissue extract. D: Electrophoresis of the reaction products of TDP1 enzymatic assay on a sequencing gel. The samples were representatives of C. Tumor samples were assayed with 80 ng of tissue extract, and non-neoplastic tissues were assayed with 80 ng and 4 μg of extract. The upper bands were the 18 mer Tyr-DNA substrate; the lower ones converted hydroxyl- and phosphoryl-DNA, respectively. A–D: N, non-neoplastic tissue; T, tumor. The lab ID number was used to name each sample.
Figure 2
Figure 2
Expression of XPF was increased in un-matched NSCLC. A: Quantitative analysis of the protein expression levels of XPF of thirty un-matched NSCLC versus eight non-neoplastic tissues. Normalization was done as described in Fig. 1A. B: Western blotting of representative samples as shown in A. All samples were loaded with 32 μg of tissue extract. All samples were loaded with 32 μg of tissue extract. C: Comparison of the fold changes of overexpressed TDP1 and XPF relative to the average expression level of non-neoplastic tissues. A–C: N, non-neoplastic tissue; T, tumor.
Figure 2
Figure 2
Expression of XPF was increased in un-matched NSCLC. A: Quantitative analysis of the protein expression levels of XPF of thirty un-matched NSCLC versus eight non-neoplastic tissues. Normalization was done as described in Fig. 1A. B: Western blotting of representative samples as shown in A. All samples were loaded with 32 μg of tissue extract. All samples were loaded with 32 μg of tissue extract. C: Comparison of the fold changes of overexpressed TDP1 and XPF relative to the average expression level of non-neoplastic tissues. A–C: N, non-neoplastic tissue; T, tumor.
Figure 3
Figure 3
Increased expression and activity of TDP1and increased expression of XPF were cancer-tissue specific. A: Western blotting of TDP1 protein in four matched NSCLC. B: Electrophoresis of the reaction products of TDP1 enzymatic assay of the same samples. All samples were assayed with both 80 ng and 4 μg of tissue extract. C: Western blotting of XPF protein of the same samples. All samples in A and C were loaded with 32 μg of tissue extract. A–C: N, non-neoplastic tissue; T, tumor.
Figure 3
Figure 3
Increased expression and activity of TDP1and increased expression of XPF were cancer-tissue specific. A: Western blotting of TDP1 protein in four matched NSCLC. B: Electrophoresis of the reaction products of TDP1 enzymatic assay of the same samples. All samples were assayed with both 80 ng and 4 μg of tissue extract. C: Western blotting of XPF protein of the same samples. All samples in A and C were loaded with 32 μg of tissue extract. A–C: N, non-neoplastic tissue; T, tumor.
Figure 4
Figure 4
Expression of MUS81 in NSCLC. A: Western blotting of four representative tumor samples versus three non-neoplastic tissues. B: Western blotting of four matched NSCLC. All samples in A and B were loaded with 32 μg of tissue extract.

References

    1. Mozzetti S, Ferlini C, Concolino P, Filippetti F, Raspaglio G, Prislei S, et al. Class iii beta-tubulin overexpression is a prominent mechanism of paclitaxel resistance in ovarian cancer patients. Clin Cancer Res. 2005;11:298–305. - PubMed
    1. Michalides R, Griekspoor A, Balkenende A, Verwoerd D, Janssen L, Jalink K, et al. Tamoxifen resistance by a conformational arrest of the estrogen receptor alpha after pka activation in breast cancer. Cancer Cell. 2004;5:597–605. - PubMed
    1. Lord RV, Brabender J, Gandara D, Alberola V, Camps C, Domine M, et al. Low ercc1 expression correlates with prolonged survival after cisplatin plus gemcitabine chemotherapy in non-small cell lung cancer. Clin Cancer Res. 2002;8:2286–91. - PubMed
    1. Pizzolato JF, Saltz LB. The camptothecins. Lancet. 2003;361:2235–42. - PubMed
    1. Stewart DJ. Update on the role of topotecan in the treatment of non-small cell lung cancer. Oncologist. 2004;9 (Suppl 6):43–52. - PubMed

Publication types

MeSH terms