. 2007 Apr 1;109(7):2708-17.
doi: 10.1182/blood-2006-07-035857.

Mechanisms of regulation of CXCR4/SDF-1 (CXCL12)-dependent migration and homing in multiple myeloma

Affiliations

Mechanisms of regulation of CXCR4/SDF-1 (CXCL12)-dependent migration and homing in multiple myeloma

Yazan Alsayed et al. Blood. .

Abstract

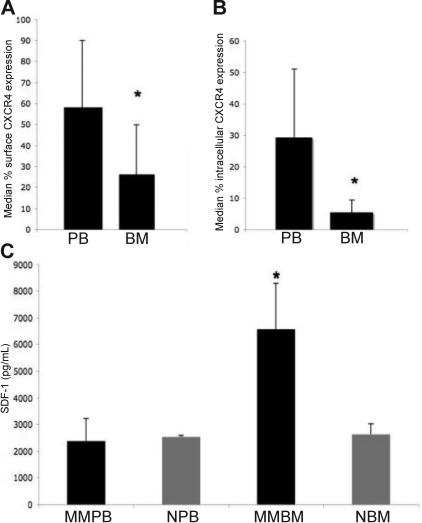
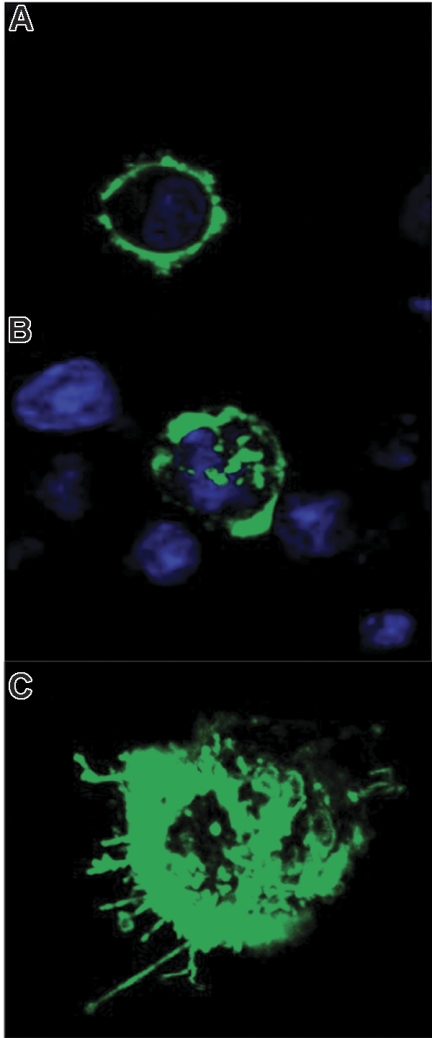
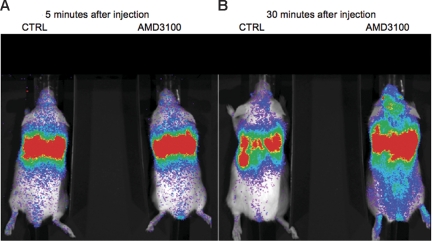
The mechanisms by which multiple myeloma (MM) cells migrate and home to the bone marrow are not well understood. In this study, we sought to determine the effect of the chemokine SDF-1 (CXCL12) and its receptor CXCR4 on the migration and homing of MM cells. We demonstrated that CXCR4 is differentially expressed at high levels in the peripheral blood and is down-regulated in the bone marrow in response to high levels of SDF-1. SDF-1 induced motility, internalization, and cytoskeletal rearrangement in MM cells evidenced by confocal microscopy. The specific CXCR4 inhibitor AMD3100 and the anti-CXCR4 antibody MAB171 inhibited the migration of MM cells in vitro. CXCR4 knockdown experiments demonstrated that SDF-1-dependent migration was regulated by the P13K and ERK/ MAPK pathways but not by p38 MAPK. In addition, we demonstrated that AMD3100 inhibited the homing of MM cells to the bone marrow niches using in vivo flow cytometry, in vivo confocal microscopy, and whole body bioluminescence imaging. This study, therefore, demonstrates that SDF-1/CXCR4 is a critical regulator of MM homing and that it provides the framework for inhibitors of this pathway to be used in future clinical trials to abrogate MM trafficking.


Figures

Figure 1
Figure 1
CXCR4 and SDF1 expression in patients with MM. (A) Surface expression of CXCR4 on plasma cells in the peripheral blood (PB) and bone marrow (BM) of patients with MM. Median percentage expression of CXCR4 in plasma cells in the PB was 60% (range, 9%-96%) compared with 26.4% (range, 1%-81%) in the BM of patients with active MM (P = .001). (B) Intracellular expression of CXCR4 on plasma cells in the PB and BM of 7 matched samples. Intracellular expression was significantly higher in all PB samples compared with BM samples, with a median percentage expression of 31.6% (range, 12%-71%) in PB plasma cells compared with 5% (range, 0%-13.6%) in BM plasma cells (P = .001). (C) SDF-1 expression as measured by ELISA. SDF-1 level was markedly increased in the BM of MM patients (MM-BM; average, 6571 pg/mL) compared with healthy controls (CTRL-BM; average, 2632 pg/mL) (P < .001). In addition, the SDF-1 level in BM was significantly elevated compared with the SDF-1 level in PB of patients with MM (average, 2382.46 pg/mL) and in healthy control (MM-PB and CTRL-PB, respectively; P = .001). Error bars represent standard deviation; asterisks, statistically significant value.
Figure 2
Figure 2
YFP-CXCR4 localization in response to SDF-1. (A) YFP-CXCR4 expression on the surfaces of MM.1S cells in unstimulated cells as determined by the fixed cell method. (B) Internalization of the CXCR4 receptor in response to SDF-1 (30 nM) stimulation for 1 hour. (C) Live cell method with 3D reconstruction demonstrating CXCR4 cytoskeletal rearrangement, capping, and pseudopodia formation in response to SDF-1.
Figure 3
Figure 3
Migration and motility in response to SDF-1. (A) Increased motility of plasma cells in response to SDF-1 with pseudopodia formation. (B) Transwell migration assay demonstrating the migration of MM.1S and U266 MM cell lines in response to serial concentrations of SDF-1 (0-100 nM). SDF-1 induced maximum migration at doses of 20 to 30 nM and decreased migration at doses of 75 to 100 nM. (C) Transwell migration assay demonstrating the migration of CD138+ primary plasma cells in response to SDF-1.
Figure 4
Figure 4
Regulation of migration by inhibitors of the CXCR4 signaling pathway. (A) Migration assay using the CXCR4 inhibitor AMD3100 (0-100 μM). AMD3100 (10 μM) induced 70% inhibition of migration compared with control (P = .03). All wells contained 20 nM SDF-1 in the lower chambers. (B) Migration assay using the anti-CXCR4 antibody MAB171. Serial concentrations of MAB171 (0-400 μg/mL) inhibited migration in a dose-dependent fashion. Anti–CXCR4 MAB171 (10 μM) inhibited migration to 53%, and anti-CXCR4 MAB171 (200 μM) inhibited migration to 35% compared with control (P = .007). IgG control antibody (400 μg/mL) was used in the control well. (C) Transwell migration assay of MM.1S mock and MM.1S infected with CXCR4 shRNA (CXCR4 knockdown cells) in the presence or absence of SDF-1 (30 nM). CXCR4 knockdown cells migrated only to 43% of control, similar to cells not exposed to SDF-1 (ie, 60% reduction in migration compared with control mock cells treated with SDF-1). Control was mock cells treated with SDF-1. (D) Transwell migration assay of MM.1S in the presence or absence of the anti-CXCR4 antibody MAB171 (200 μg/mL). SDF-1 (30 nM) was placed in the lower chamber in the control wells. Bone marrow supernatant from patients with MM (2 patients) was placed in the lower chambers of the other wells. The BM supernatant bar represents the mean percentage migration of MM.1S compared with control. MM.1S migrated in response to BM supernatant (75.6%) compared with control. MAB171 resulted in 36% inhibition of migration in the SDF-1 chambers and 52.5% inhibition of migration in the chambers with BM supernatant. (E) MTT growth inhibition assay using MM cell lines treated with serial concentrations of AMD3100. AMD3100 did not inhibit survival compared with control. (F) Migration assay in MM.1S treated with inhibitors of pathways downstream of CXCR4: PTX, LY294002, rapamycin, PD098059, combination LY 294002 and PD098059, and p38 MAPK inhibitor SB203580. SDF-1 (30 nM) was placed in the lower chambers. PTX (50 ng/mL) significantly inhibited migration to 30% compared with control in the presence of 30 nM SDF-1 (P = .004). The PI3K inhibitor LY294002 and the MEK inhibitor PD098059 inhibited migration by 57% and 58%, respectively. Rapamycin downstream of PI3K demonstrated results similar to those of LY294002. The combination of the PI3K and ERK/MAPK inhibitors was not additive (59%), indicating that both signal through the same pathway. The p38 MAPK inhibitor SB203580 (SB) did not inhibit migration in response to SDF-1.
Figure 5
Figure 5
Signaling pathways regulated by SDF1/CXCR4 in MM. (A) Immunoblotting for pERK and pAKT, demonstrating rapid activation in response to SDF-1 30 nM in a time-dependent fashion at 1, 3, and 5 minutes. (B) Immunoblotting for total CXCR4 demonstrating up-regulation of CXCR4 by SDF-1 (30 and 100 nM for 5-minute incubation) and inhibition by AMD3100 (100 μM for 16-hour incubation), even in the presence of SDF-1 stimulation. (C) Immunoblotting for pPI3K (p85) demonstrating activation in response to SDF-1 in a dose-dependent fashion with maximum activation at 100 nM at 5 minutes. This effect was abrogated by AMD3100 (30-100 μM for 16-hour incubation), confirming that SDF-1 activates PI3K through CXCR4. (D) Immunoblotting for PKC, pAKT, and pERK1/2 in the presence or absence of AMD3100 (30 μM for 16-hour incubation). SDF-1 led to a rapid up-regulation of pPKC, pAKT, and pERK1/2 at 1 minute and 5 minutes. AMD3100 inhibited the expression of pPKC, pAKT, and pERK1/2. (E) Immunoblotting with CXCR4 knockdown MM.1S (lanes 3-4) and mock-infected MM.1S (lanes 1-2), with or without stimulation with 30 nM SDF-1 for 1 minute. CXCR4 knockdown with shRNA led to the inhibition of CXCR4, p-PDK-1, pAKT, and pERK1/2, but not p-p38 MAPK. (F) Immunoblotting for pERK and pAKT in the presence of 50 ng/mL pertussis toxin (PTX) for 90 minutes. SDF-1 (30 nM) induced pERK and pAKT as a control in lane 1. PTX inhibited pERK and pAKT even in the presence of SDF-1, indicating that activation of these pathways by SDF-1 is Gi dependent. (G) Immunoblotting for pAKT and pERK in the presence of the PI3K inhibitor LY294002 (25 μM for 20 minutes) or the MEK inhibitor PD098059 (25 μM for 90 minutes) with or without SDF-1. LY294002 inhibited pAKT even in the presence of SDF-1, whereas PD294002 did not affect AKT activity. LY294002 inhibited pERK1/2, indicating that ERK/MAPK is downstream of PI3K. PD294002 inhibited pERK activity even in the presence of SDF-1.
Figure 6
Figure 6
In vivo flow cytometry and confocal microscopy imaging of MM.1S in the presence or absence of AMD3100. (A) In vivo confocal flow cytometry. DiD-labeled cells (treated with 50 μM AMD3100 for 2 hours or untreated control) were injected in the tail veins of 2 BALB/c mice. Cells were counted every 5 minutes for 1 hour. The cell count decreased by 86% in the control and by 47% in the AMD3100-treated mouse (P = .002). (B) In vivo confocal imaging of 4 quadrants of the skulls of mice showing BM niches on each side of the sagittal sinus (center of each picture). Fluorescent cells homed to the parasagittal vascular segments in the untreated control mouse; the number of cells that homed to the BM was significantly lower in the AMD3100-treated mouse. (C) Mean cell count of fluorescent cells that homed to BM niches in areas 3 and 4 in 3 experiments of the untreated (CTRL) and treated AMD3100 mice. The cell count in the AMD3100-treated mice decreased to 38% compared with control (P = .01).
Figure 7
Figure 7
Bioluminescence imaging of Luc+ MM.1S cells injected intravenously into the tail veins of SCID/NOD mice. Cells were incubated in vitro before injection in 50 μM AMD3100 or control PBS for 4 hours at 37°C. Whole body real-time bioluminescence imaging was performed every 5 minutes for 90 minutes after injection. (A) Equal distribution of bioluminescence in the control (CTRL) and treated (AMD3100) mice 5 minutes after injection. (B) Thirty minutes after injection, fluorescence intensity diminished in the cardiopulmonary area, indicating exit from the circulation in the CTRL mice. In AMD3100-treated mice, bioluminescence remained high in the cardiopulmonary area.

References

    1. Kyle RA, Rajkumar SV. Multiple myeloma. N Engl J Med. 2004;351:1860–1873. - PubMed
    1. Jemal A, Murray T, Ward E, et al. Cancer statistics, 2005. CA Cancer J Clin. 2005;55:10–30. - PubMed
    1. Nowakowski GS, Witzig TE, Dingli D, et al. Circulating plasma cells detected by flow cytometry as a predictor of survival in 302 patients with newly diagnosed multiple myeloma. Blood. 2005;106:2276–2279. - PMC - PubMed
    1. Billadeau D, Van Ness B, Kimlinger T, et al. Clonal circulating cells are common in plasma cell proliferative disorders: a comparison of monoclonal gammopathy of undetermined significance, smoldering multiple myeloma, and active myeloma. Blood. 1996;88:289–296. - PubMed
    1. Luster AD. Chemokines—chemotactic cytokines that mediate inflammation. N Engl J Med. 1998;338:436–445. - PubMed

Publication types

MeSH terms