. 2006 Nov;4(12):e382.
doi: 10.1371/journal.pbio.0040382.

Interdigitated paralemniscal and lemniscal pathways in the mouse barrel cortex

Affiliations

Interdigitated paralemniscal and lemniscal pathways in the mouse barrel cortex

Ingrid Bureau et al. PLoS Biol. 2006 Nov.

Erratum in

  • PLoS Biol. 2007 Jan;5(1):e28

Abstract

Primary sensory cortical areas receive information through multiple thalamic channels. In the rodent whisker system, lemniscal and paralemniscal thalamocortical projections, from the ventral posteromedial nucleus (VPM) and posterior medial nucleus (POm) respectively, carry distinct types of sensory information to cortex. Little is known about how these separate streams of activity are parsed and integrated within the neocortical microcircuit. We used quantitative laser scanning photostimulation to probe the organization of functional thalamocortical and ascending intracortical projections in the mouse barrel cortex. To map the thalamocortical projections, we recorded from neocortical excitatory neurons while stimulating VPM or POm. Neurons in layers (L)4, L5, and L6A received dense input from thalamus (L4, L5B, and L6A from VPM; and L5A from POm), whereas L2/3 neurons rarely received thalamic input. We further mapped the lemniscal and paralemniscal circuits from L4 and L5A to L2/3. Lemniscal L4 neurons targeted L3 within a column. Paralemniscal L5A neurons targeted a superficial band (thickness, 60 mum) of neurons immediately below L1, defining a functionally distinct L2 in the mouse barrel cortex. L2 neurons received input from lemniscal L3 cells and paralemniscal L5A cells spread over multiple columns. Our data indicate that lemniscal and paralemniscal information is segregated into interdigitated cortical layers.


Conflict of interest statement

Competing interests. The authors have declared that no competing interests exist.

Figures
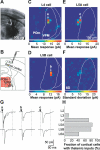
Figure 1
Figure 1. Laser Scanning Photostimulation Mapping of Thalamocortical Projections
(A) Montage of a thalamocortical slice. (B) Layout of the experiment. Excitatory neurons were recorded in the barrel cortex while thalamic neurons were photostimulated by glutamate uncaging. The map pattern (red grid) was centered on the POm/VPM boundary. Dashed lines indicate a barrel-column. (C–E) Examples of synaptic input maps for individual L4 (C), L5B (D), and L5A (E) neurons. The pixel values encode the mean amplitudes of EPSCs measured within 100 ms after the stimulus (see [G]). The dashed lines indicate the borders between POm, VPM, and the ventral posterolateral nucleus (VPL) (see [B]). Letters mark a pair of pixels corresponding to the traces shown in (G). (F) Map of standard deviations across trials for an individual cell (same cell as in [E]). (G) Examples of individual EPSCs. The responses were evoked by photostimulation at the sites indicated by letters in (C–E) (two sites per arrow). Arrowheads indicate the timing of the stimulus; dashed lines indicate the averaging window used for analysis. (H) Percentage of cortical cells with thalamic input. The percentage was computed for cells that were within a lateral distance of 300 μm of cells that showed thalamic input in the brain slice.
Figure 2
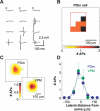
Figure 2. Spatial Resolution of LSPS in the Somatosensory Thalamus
(A) Photostimulation-evoked APs recorded in loose-patch mode in a POm cell (arrowheads indicate the stimulus). The traces correspond to the 12 pixels in the boxed region shown in (B). (B) Excitation profile of a single POm cell. The grid was centered on the soma. Pixel values encode the number of APs in a 100-ms window after photostimulation. (C) Average excitation profiles (VPM, n = 7; POm, n = 7). (D) Excitation as a function of lateral distance from the soma (at 0). Responses elicited in each column of the 8 × 8 grid were summed.
Figure 3
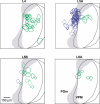
Figure 3. Laminar Organization of Thalamocortical Projections
Overlay of input domains for L4, L5A, L5B, and L6A cells. The contours enclose regions where the inputs exceed 50% of the largest responses (VPM, green; POm, blue). Dashed contours correspond to pyramidal cells with apical dendrites that were cut below L1. Shaded area denotes the range of POm/VPM boundaries for all experiments.
Figure 4
Figure 4. Thalamic Input Domains Projecting to Individual Cortical Columns
(A–D) Schematic of the locations of recorded neurons (left), input maps (middle), and overlaid input domains (right) Circles in the input domains indicate the largest responses from a pair of L4 cells in the same column (A), a pair of L4 cells in neighboring columns (B), a pair of L5A cells in the same column (C) and a pair of L5A cells in neighboring columns (D). (E) Distance between the largest input in the synaptic input maps (green, VPM; blue, POm) from pairs recorded in the same column or in neighboring columns. The average (thick line), and the minimum and maximum distances between largest input across cells (rectangle) are shown. Numbers in parenthesis are the number of pairs. The pairs of cells located in the same column were three L4/L4, five L4/L5B, four L4/L6A, two L5B/L6A, one L6A/L6A, and six L5A/L5A. Pairs of cells located in neighboring columns were four L4/L4, one L4/L5B, and six L5A/L5A cells. (F) Areas of the input domains in VPM (green) and POm (blue) for pairs of L4/L5B/L6A, and L5A cells located in the same column.
Figure 5
Figure 5. Thalamocortical Topographic Transformations
(A) Schematic of the coordinate system. X ID and Y ID are the horizontal and vertical coordinates of the input domain, respectively. X Soma is the horizontal coordinate of the cell position in cortex. X ID and X Soma are measured from the VPM/POm boundary (center of the uncaging grid; light red). Y ID is measured from the bottom of VPM (bottom of the uncaging grid). (B) and (C) Positions of the input domains (Y ID in B; X ID in C) in VPM (green) and POm (blue) as a function of X Soma. Cells were in L4 (n = 12); L5B (n = 7); L6A (n = 5); and L5A (n = 21). Dashed line shows the linear correlation between X Soma and Y ID for VPM and POm domains (r2 = 0.72).
Figure 6
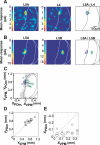
Figure 6. Somatotopic Maps in VPM and POm
(A) Synaptic input maps (left) for a pair of L5A and L4 cells recorded in the same barrel-related column, and the overlaid input domains (right). Circles indicate the position of the largest responses in the input domains. (B) Same as (A) for a pair of L5A and L5B cells. (C) Positions of the centers of POm (blue) and VPM (green) input domains for pairs of cells recorded in the same column. (D) and (E) Distances of the centers of the input domains from the bottom of VPM (Y POm, Y VPM; [D]) and from the POm/VPM boundary (X POm, X VPM; [E]) for pairs of cells recorded in the same column (coordinate system is indicated in [C]). Larger symbols indicate overlay of multiple pairs (L5A/L4, n = 13; L5A/L5B, n = 5; L5A/L6A, n = 2). Dashed lines indicate the predicted relationships if VPM and POm somatotopy was mirror symmetric.
Figure 7
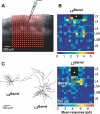
Figure 7. Laser Scanning Photostimulation Mapping of Intracortical Projections to L2/3 neurons
(A) Across-barrel slice showing barrels corresponding to rows A–E (from left to right) under brightfield illumination. In this experiment, the map pattern (red grid) was centered on the septum between the barrels C and D. (B) Examples of synaptic input maps for a L2Barrel cell (top) and a L3Barrel cell (bottom). Black pixels are sites where glutamate uncaging evoked direct responses in the recorded cells, polluting the synaptic responses. Dashed lines indicate the barrel positions. Solid white circles show the cell body positions of the recorded neurons. (C) Examples of dendritic morphologies of L2Barrel and L3Barrel cells (same cells as in [B]).
Figure 8
Figure 8. Interdigitated Intracortical Relays
(A) Average synaptic input maps for positionally defined L2/3 pyramidal cells. (B) Regions of interest used for the analysis in (C–E). (C) The ratio of input from L5A/L4 as a function of the depth of the soma of barrel-related neurons. Dashed black line (top) indicates the pia. (D) The ratio of input from L2/3/L4. (E) Average synaptic input for projections defined by the presynaptic layer, postsynaptic layer, and postsynaptic column. For L3 neurons in septum and barrels, L4 input is significantly stronger than L5A input; for L2 neurons in barrels, L5A input is significantly stronger than L4 input (p < 0.005, Wilcoxon). Note that this pattern differs from that measured in the rat using essentially identical techniques (see Figure 3e in [13]). L3 input is significantly stronger for L2/3Septum cells than for L2/3Barrel cells (p < 0.05, Wilcoxon). (F) Horizontal profiles of L4 input to L3 cells. (G) Horizontal profiles of L5A input to L2 cells.
Figure 9
Figure 9. Circuit Diagram of the Thalamocortical and Ascending Intracortical Projections in the Barrel Cortex
Lemniscal projections, green; paralemniscal projections, blue. Thick, thin, and dashed lines denote decreasing density of the projection.

Comment in

References

    1. Woolsey TA, Van der Loos H. The structural organization of layer IV in the somatosensory region (S1) of mouse cerebral cortex. Brain Res. 1970;17:205–242. - PubMed
    1. Agmon A, Connors BW. Thalamocortical responses of mouse somatosensory (barrel) cortex in vitro. Neuroscience. 1991;41:365–379. - PubMed
    1. Rice FL. Comparative aspects of barrel structure and development. In: Jones EG, Diamond IT, editors. The barrel cortex of rodents. New York: Plenum Press; 1995. pp. 1–76.
    1. Welker C. Microelectrode delineation of fine grain somatotopic organization of (SmI) cerebral neocortex in albino rat. Brain Res. 1971;26:259–275. - PubMed
    1. Brecht M, Sakmann B. Dynamic representation of whisker deflection by synaptic potentials in spiny stellate and pyramidal cells in the barrels and septa of layer 4 rat somatosensory cortex. J Physiol. 2002;543:49–70. - PMC - PubMed

Publication types