. 2006 Nov;4(12):e396.
doi: 10.1371/journal.pbio.0040396.

A posterior centre establishes and maintains polarity of the Caenorhabditis elegans embryo by a Wnt-dependent relay mechanism

Affiliations

A posterior centre establishes and maintains polarity of the Caenorhabditis elegans embryo by a Wnt-dependent relay mechanism

Marcus Bischoff et al. PLoS Biol. 2006 Nov.

Abstract

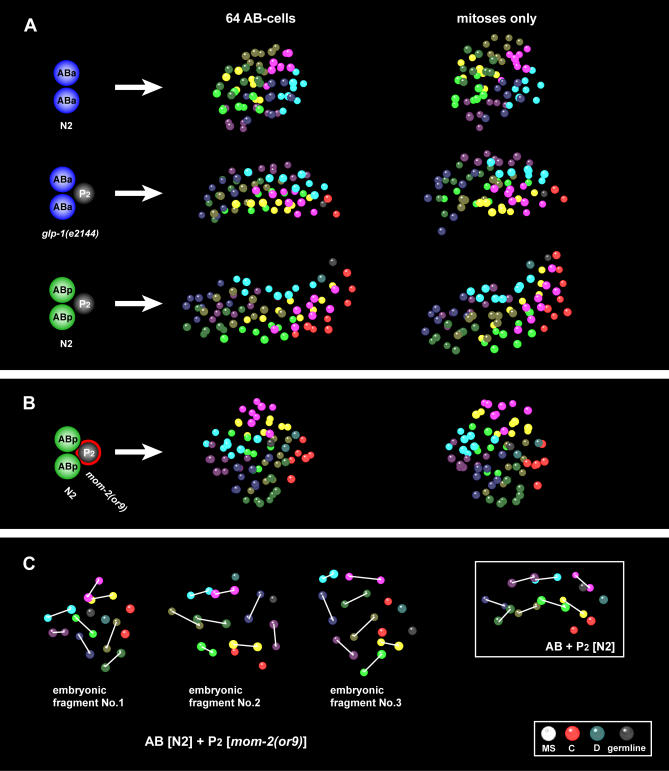
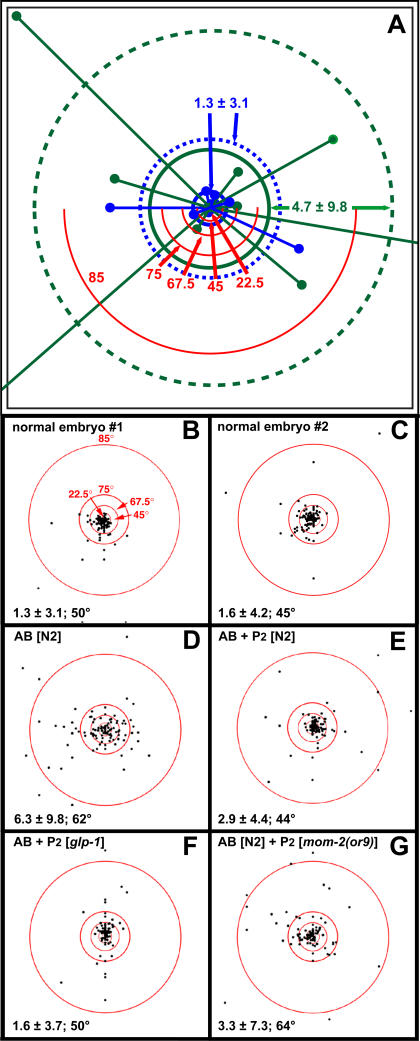
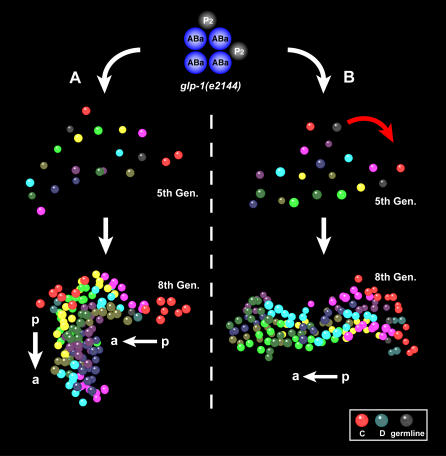
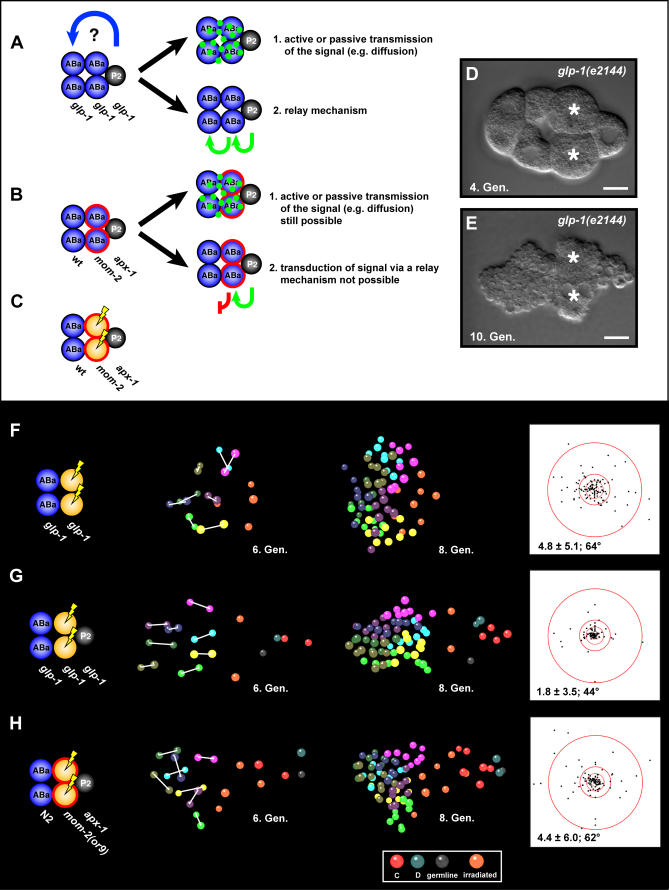
Cellular polarity is a general feature of animal development. However, the mechanisms that establish and maintain polarity in a field of cells or even in the whole embryo remain elusive. Here we provide evidence that in the Caenorhabditis elegans embryo, the descendants of P1, the posterior blastomere of the 2-cell stage, constitute a polarising centre that orients the cell divisions of most of the embryo. This polarisation depends on a MOM-2/Wnt signal originating from the P1 descendants. Furthermore, we show that the MOM-2/Wnt signal is transduced from cell to cell by a relay mechanism. Our findings suggest how polarity is first established and then maintained in a field of cells. According to this model, the relay mechanism constantly orients the polarity of all cells towards the polarising centre, thus organising the whole embryo. This model may also apply to other systems such as Drosophila and vertebrates.


Conflict of interest statement

Competing interests. The authors have declared that no competing interests exist.

Figures

Figure 1
Figure 1. P2 Polarises the AB Descendants Depending on MOM-2/Wnt
The left column of panels (A) and (B) shows the combination of the early blastomeres used in the experiments. Blastomere genotypes and fates (as determined by lineaging) are indicated. mom-2 blastomeres are marked with a red margin. The middle column shows the positions of the nuclei at the end of the eighth generation of cells (64 AB descendants) using the 3-D representation feature of SIMI Biocell. Positions were determined by following the development of all cells. AB-derived regions, founded at the 8-AB cell stage (fifth generation) [25], were colour coded independently of their fate to show the topology of each region. P1 descendants are colour coded according to their fate. The right column shows 3-D representations of the same generation that illustrate how embryonic fragments look if the contribution of cell movements is removed using an algorithm described in [16] so that only the contribution of mitoses is left (“mitoses only”). In (C) 3-D representations of the sixth generation of cells (16 AB descendants) are shown. To indicate the orientation of the cleavages of their mother cell, the two sisters are connected with a white bar shortly after mitosis. (A) Development of isolated AB blastomeres (the two ABx daughters are shown on the left) compared to AB blastomeres to which a P2 blastomere was added after the two daughters were born. P2 causes the embryonic fragment to elongate independently of whether only ABa or ABp fates are present. As becomes obvious from the colour code, the AB-derived regions stretch out along the axis defined by P2 whereas they do not in isolated AB cells. The elongation is caused by the alignment of mitoses along the a-p axis [see white box in (C) and Figure 2D–2F]. A comparison of the original and the “mitoses only” representations reveals that the shape of the embryonic fragments is mainly due to mitoses. This suggests that a bias in mitosis direction is the cause of the elongation of the embryonic fragments. (B) Chimeric embryonic fragment consisting of a wild-type AB and a mom-2(or9) P2 blastomere. This mom-2 allele prevents the elongation of the embryonic fragment completely. Like in an isolated AB blastomere (A), the eight AB-derived regions are not elongated, indicating that the mitoses of all AB-derived cells were not mainly oriented towards the P2 blastomere (Figure 2G). Again, the original and the “mitoses only” representations look very similar. (C) Orientation of cell divisions (fifth division of AB-derived blastomeres) in three embryonic fragments where wild-type AB and mom-2 P2 blastomeres were combined [embryonic fragment 1 also shown in (B)] and a wild-type control (white box). In contrast to the wild-type control embryonic fragment, divisions are not directed towards the position of P2 and its descendants. For a quantitative analysis of division angles of embryonic fragments, see Figure 2. Furthermore, the shown wild-type embryonic fragment exemplifies that AB-derived cells that do not touch P2 also orient their divisions towards P2.
Figure 2
Figure 2. Quantitative Analysis of Cleavage Orientation
(A) Scheme explaining the quantitative analysis of cleavage orientation using “Löwe projections”. The directions of cell cleavages of all cells are visualised by dots projected on a target screen in which the centre represents the a-p axis. These dots are obtained in the following way: each dividing cell is placed on the a-p axis and a vector is projected from the centre of the mother cell through the centre of the daughter cell. The point where this vector hits a target screen is marked by a dot (the distance between mother cell and screen along the a-p axis is normalised to 1). The red semi-circles represent particular division angles (as indicated). Embryos were analysed from four to 64 AB-derived cells. For statistical analysis, the mean distance of the dots from the target centre and the standard deviation are calculated. This “Löwe value” and its standard deviation give a reasonable measure of the general direction of cell cleavages. This is exemplified by showing nine cleavages of a “polarised” normal embryo (blue) and a “nonpolarised” isolated AB blastomere (green). The mean is indicated by a circle and the standard deviation by a dotted circle. Note that the representation of cleavage angles is not linear, because the distance from the centre to a dot corresponds to the tangent of the cleavage angle to the a-p axis. Thus, angles close to 90 ° cannot be shown on the target screen (here, this is the case for two cleavages of the “nonpolarised” isolated AB blastomere). It becomes obvious that for the normal embryo, in which cells divide mainly along the a-p axis, most dots are located in close proximity to the centre and the corresponding Löwe value is low. In contrast, the dots are widely scattered for the isolated AB blastomere, in which cells do not mainly divide in the a-p direction, and the Löwe value is high. (B–G) “Löwe projections” of two normal embryos and the embryonic fragments shown in Figure 1A and 1B. The red circles correspond to the red semicircles in (A). In the lower left corner, Löwe values and mean division angles are shown. (B and C) Normal embryos #1 and #2 from [16,25]. Cells mainly divide in an a-p direction. The Löwe value and especially its standard deviation are low. If a third normal embryo (not shown) is also considered, normal embryos have Löwe values between 1.3 and 1.6 with standard deviations ranging from 3.0 to 4.2. The mean cleavage angles vary between 45 ° and 50 °, the standard deviations between 20 ° and 23 °. (D) Isolated AB blastomere. Compared to normal embryos (B and C) and AB blastomeres where a P2 blastomere was added (E), the division angles scatter all over the target area; i.e., cells do not mainly divide in the a-p direction. This is reflected in the higher Löwe value and especially the high standard deviation. Five points are off the target screen due to 90 ° divisions. (E) AB blastomere where P2 was added. Cells mainly divide in the a-p direction, and the Löwe value and its standard deviation decrease noticeably compared to the isolated AB blastomere in (D). (F) AB blastomere where P2 was added in a glp-1(e2144) background. Again, cells mainly divide in the a-p direction. (G) Addition of a mom-2(or9) P2 blastomere to a wild-type AB blastomere. Cells do not mainly divide in the a-p direction. The Löwe value is higher than in embryonic fragments dividing mainly in the a-p direction and its standard deviation resembles the standard deviation of the isolated AB blastomere.
Figure 3
Figure 3. P2 and Its Descendants Organise Polarity Continuously
For details, see legend to Figure 1. Two mutually perpendicular P2 blastomeres were added to the daughters of AB in a glp-1(e2144) background. Two different outcomes of the experiment are shown in (A) and (B). (A) All the P2 descendants stay in their original position; an L-shaped pattern with two a-p axes is formed. (B) The descendants of one P2 blastomere shifted posteriorly and joined the other P2 descendants (red arrow). This displacement of the P2 descendants began in the shown fifth generation. It resulted in an elongated structure with only one a-p axis as can be seen in the eighth generation.
Figure 4
Figure 4. The Polarising Signal Is Transferred from AB Blastomere to AB Blastomere by a Relay Mechanism
For details see legend to Figure 1. mom-2 blastomeres are marked by a red outline. (A–C) Schemes showing the designs of experiments. (D and E) DIC images of the fragment analysed in (G). Bars, 10 μm. (D) shows fragment after laser ablation of the two central blastomeres. Irradiated cells are marked with asterisks. (E) shows terminal stage of the fragment. (F–H) Experiments where the central AB descendants were irradiated. The leftmost column shows the designs of the experiments. In the next column, division angles of the 16-AB cell stages are indicated by a white bar connecting sister cells shortly after mitosis. Further to the right, the 3-D representations of the 64-AB cell stages are shown. The column most to the right shows the Löwe projections of the division angles. (F) and (G) show two of the control experiments using wild-type, glp-1, or apx-1 blastomeres (Table 1, rows M and N). (F) Control experiment without P2. No elongation of the nonablated part of the AB-derived embryonic fragment occurred. (G) Control experiment with P2 glp-1 background to prevent induction of ABp fates. The mitosis directions of the fifth division, which produces the sixth generation of cells, in the nonablated part of the AB-derived embryonic fragment indicate a polarisation of the blastomeres. The fragment elongates. This experiment shows that laser ablation does not hinder a potentially diffusing or transported signal. (H) Two mom-2 AB-derived daughters between P2 and wild-type AB-derived cells prevent elongation (Table 1, row O). Mitoses are not directed towards P2.
Figure 5
Figure 5. Polarised AB Descendants Transfer Their Polarity
(A) Design of the experiment shown in (B). (B–E) Left column: 3-D representations of the 64-AB cell stages of various experiments. The eight AB-derived regions are colour-coded independently of their fate to show the topology of each region. Middle column: “Löwe projections” (see Figure 2A for explanation). Right column: 3-D representations from which the contribution of cell movements was removed (“mitoses only”, see legend to Figure 1). In all experiments presented, these “mitoses only” representations resemble the original embryonic fragment, which suggests that the shape of the embryonic fragments is mainly due to cleavage orientation. (B) Combination of an isolated AB blastomere (ABa) and a blastomere which touched P2 transiently (ABp). Four of the eight AB-derived regions of the ABp blastomere (right side of embryonic fragment; blue, violet, dark yellow, and light yellow) elongate comparable to regions in the experiment where a single isolated AB transiently touched P2 (see Figure 5D). These regions align in a V-shape configuration, possibly because their elongation is hampered by the descendants of the other AB blastomere (left side of embryonic fragment). The “Löwe projections” show that the cells of the ABp blastomere (right) divide mainly in the direction of the point where P2 was transiently added. Additionally, the cleavages of the originally nonpolarised ABa blastomere (left) are mainly directed towards the added polarised ABp blastomere (which is here represented by the centre of the target area). (C) Combination of two isolated AB blastomeres. Both cells have never been exposed to a polarising signal, similar to the ABa blastomere in (B). A round structure with nonelongated regions forms (Table 1, row K). The direction of cleavages appears to be nonpolarised compared to (B). (D) Single AB blastomere that transiently touched P2. Cells mainly divide in the direction where the point of contact between AB and P2 has been. A nicely elongated structure forms (Table 1, row Q). This elongation resembles the behaviour of the polarised ABp blastomere in (B). (E) Experiment in which a mom-2 P2 blastomere touched a wild-type AB blastomere transiently. The ABp fate is induced by P2 but, because of the absence of a polarising signal, cells behave in a nonpolarised way compared to the experiment where a wild-type P2 blastomere was added transiently to AB-derived blastomeres (D).

Comment in

  • Back to Front in C. elegans.
    Jones R. Jones R. PLoS Biol. 2006 Dec;4(12):e426. doi: 10.1371/journal.pbio.0040426. Epub 2006 Nov 21. PLoS Biol. 2006. PMID: 20076511 Free PMC article. No abstract available.

Similar articles

Cited by

References

    1. Keller R. Shaping the vertebrate body plan by polarized embryonic cell movements. Science. 2002;298:1950–1954. - PubMed
    1. Baena-Lopez LA, Baonza A, Garcia-Bellido A. The orientation of cell divisions determines the shape of Drosophila organs. Curr Biol. 2005;15:1640–1644. - PubMed
    1. Gong Y, Mo C, Fraser SE. Planar cell polarity signalling controls cell division orientation during zebrafish gastrulation. Nature. 2004;430:689–693. - PubMed
    1. Brownlee C, Bouget F-Y, Corellou F. Choosing sides: Establishment of polarity in zygotes of fucoid algae. Seminars Cell Dev Biol. 2001;12:343–351. - PubMed
    1. Labbe JC, Goldstein B. Embryonic development: A new SPN on cell fate specification. Curr Biol. 2002;12:R396–398. - PubMed

Publication types

MeSH terms

Substances