. 2006 Nov 24;2(11):e161.
doi: 10.1371/journal.pcbi.0020161. Epub 2006 Oct 12.

Computational inference of neural information flow networks

Affiliations

Computational inference of neural information flow networks

V Anne Smith et al. PLoS Comput Biol. .

Abstract

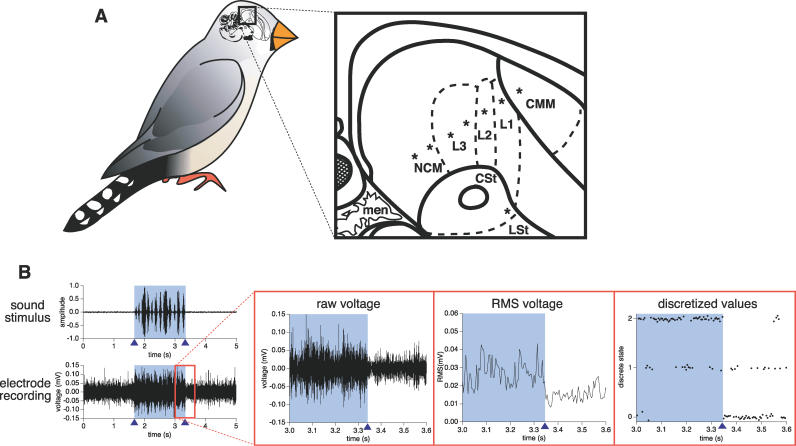
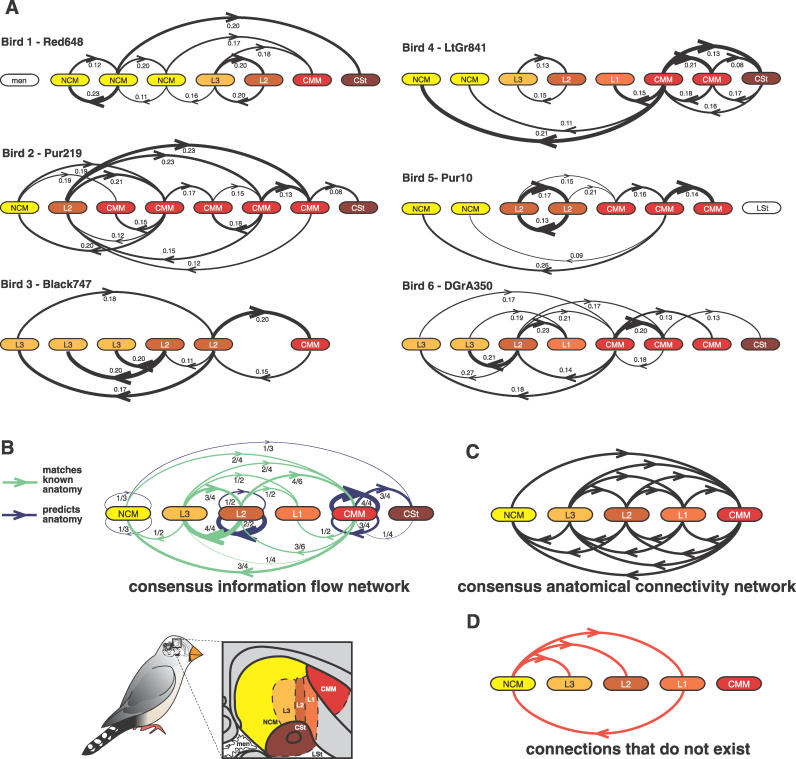
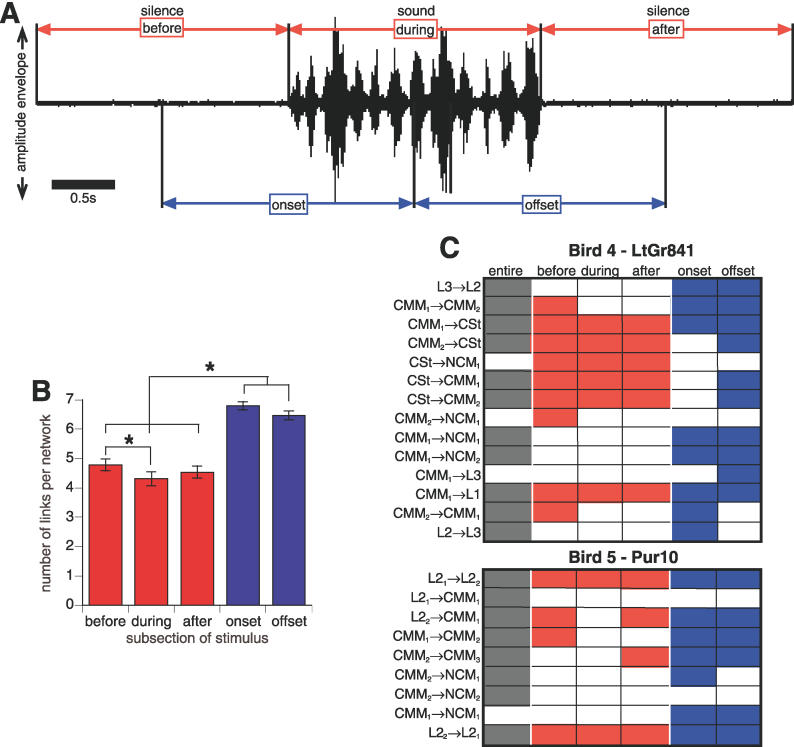
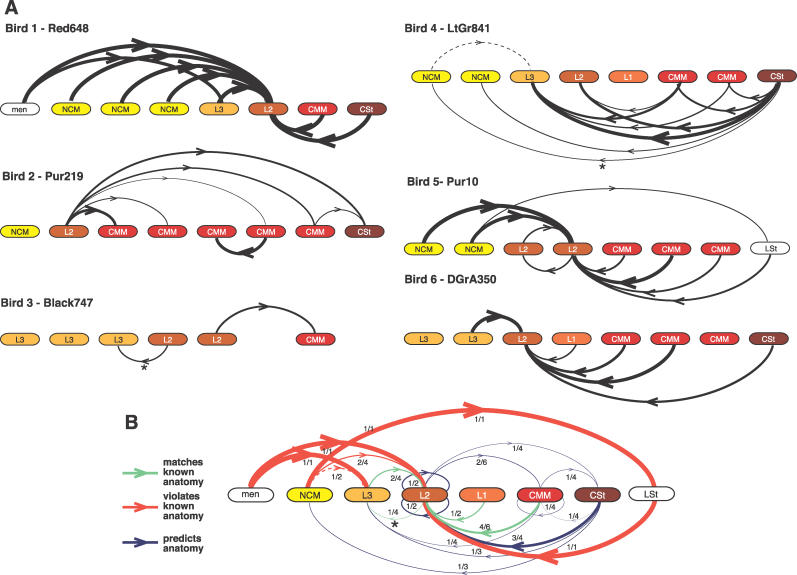
Determining how information flows along anatomical brain pathways is a fundamental requirement for understanding how animals perceive their environments, learn, and behave. Attempts to reveal such neural information flow have been made using linear computational methods, but neural interactions are known to be nonlinear. Here, we demonstrate that a dynamic Bayesian network (DBN) inference algorithm we originally developed to infer nonlinear transcriptional regulatory networks from gene expression data collected with microarrays is also successful at inferring nonlinear neural information flow networks from electrophysiology data collected with microelectrode arrays. The inferred networks we recover from the songbird auditory pathway are correctly restricted to a subset of known anatomical paths, are consistent with timing of the system, and reveal both the importance of reciprocal feedback in auditory processing and greater information flow to higher-order auditory areas when birds hear natural as opposed to synthetic sounds. A linear method applied to the same data incorrectly produces networks with information flow to non-neural tissue and over paths known not to exist. To our knowledge, this study represents the first biologically validated demonstration of an algorithm to successfully infer neural information flow networks.


Conflict of interest statement

Competing interests. The authors have declared that no competing interests exist.

Figures

Figure 1
Figure 1. Electrophysiological Recording from Songbird Auditory Forebrain
(A) Electrode placements. Zebra finch drawing shows a sagittal brain section (to scale, ∼1.1 cm in length); the boxed area highlights the auditory regions, magnified on the right. Microelectrode arrays were placed in a linear posterior–anterior orientation (asterisks [*] indicate electrode locations), in nearly all known major auditory pallial (nidopallium caudale mediale [NCM], fields L3, L2, L1, and caudal medial mesopallium [CMM]) and striatal (caudal striatum [CSt]) regions. Of the 48 electrodes placed in the six birds, two ended up outside of the auditory pathway (one in the lateral striatum [LSt] and one in the meninges [men]). The anatomical terms used are those of the new avian brain nomenclature [56]. Solid lines, brain subdivisions; dashed lines, auditory regions. (B) Data processing. From left to right: amplitude envelope of a song stimulus above measured voltage changes sampled from an L2 electrode during stimulus presentation; magnification of the voltage changes; RMS values of these voltages; three-state discretization of these RMS values (presented with jitter for clarity). Shaded region, sound; triangles, onset and offset of sound.
Figure 2
Figure 2. Generation of Information Flow Networks from Songbird Brain Using a DBN Algorithm
(A) Inferred neural information flow networks. Networks show significant interactions compiled across the 16 (or 12 for bird 1) inferred networks from hearing all stimuli across all days. Line thickness is proportional to the square of link occurrence frequency; numbers denote average influence scores. The order of the variables in the recovered DBN is the order of electrodes in the brain from posterior (left) to anterior (right). Multiple electrodes were sometimes within the same region. Brain regions are color-coded to highlight differences in electrode placement across birds. Bird 3 had two electrodes that were short-circuited and transmitted no signal; thus, these are not shown. (B) Consensus flow network compiled from the interactions of all birds from (A). Each oval represents one region. Lines connecting a region to itself represent those between two or more electrodes in the same region; those directed to the right indicate an interaction from one electrode to another anterior to it in the same region; those to the left indicate the reverse. Green lines, known anatomical paths; blue lines, predictions about anatomical connections between regions where connectivity is currently unknown. It was not possible to recover internal interactions in L1 or CSt, as no bird had more than one electrode in these regions. Fractions represent the number of birds in which such an interaction occurred out of the number of birds in which such an interaction was possible. Line thickness is proportional to the square of these fractions. (C) Consensus connectivity network of known anatomical connections of auditory forebrain regions determined across many birds from multiple studies [,,–59]. Connectivity of CSt is not well-characterized and therefore not shown. (D) The four anatomical connections among auditory regions known not to exist.
Figure 3
Figure 3. Analysis of Networks Generated from Birds Hearing Stimulus Subsections
(A) Sample amplitude envelope of a 6-s song stimulus, showing equal size stimulus subsections. Scale bar = 0.5 s. (B) Average number of links per network for each subsection. Asterisks (*) indicate Bonferroni-corrected significance at α = 0.05 (Table S3). Error bars represent standard errors of the mean. (C) Significantly consistent interactions recovered from subsections compared with those recovered from the entire stimulus period, for two example birds. Datasets are shown in columns, interactions in rows. Filled cell indicates that the interaction was significantly consistent (grey, entire stimulus; red, nontransition subsections; blue, transition subsections). Arrows (→) indicate direction of flow. For multiple electrodes within the same brain region, higher subscript number indicates more anterior electrode.
Figure 4
Figure 4. Neural Information Flow Networks Inferred by PDC for Each of the Six Birds (A) and the Resulting Consensus Network (B)
Explanation of networks is the same as in Figure 2A and 2B, respectively. Asterisks (*) indicate the two interactions in individual birds (A) and the interaction in the consensus network (B) that drop out if data segments showing a poor model fit are removed from the analyses; dashed line represents the one interaction added when these segments are removed; approximately 10% of the segments for each bird show a poor model fit for PDC. In (B), green lines, known anatomical paths; blue lines, predictions about connections between regions where connectivity is currently unknown; red lines, conflicts with known anatomy.
Figure 5
Figure 5. Neural Information Flow Differences due to Hearing Different Kinds of Stimuli
(A) Edit distances of networks generated from noise and song stimuli, (B) from plain noise and amplitude-modulated noise, and (C) from two different sets of songs. Error bars represent standard errors of the mean. Asterisks (*) indicate Bonferroni-corrected significance at α = 0.05 (Table S3). (D,E) Differences in information flow between hearing noise and song stimuli, mapped onto the consensus neural flow network of Figure 2B. Colored lines, present more often for the indicated stimuli in at least n − 1 of n ≥ 4 birds, with no birds showing opposite preference. Line thickness is proportional to the square of the ratio of presence in noise over song for (D) and in song over noise for (E), averaged across all six birds. The line from L3 to NCM in (E) is set to a maximum thickness, as it had an extreme ratio in one bird for song stimuli.

References

    1. Friston KJ. Functional and effective connectivity in neuroimaging: A synthesis. Hum Brain Mapp. 1994;2:56–78.
    1. Horwitz B. The elusive concept of brain connectivity. Neuroimage. 2003;19:466–470. - PubMed
    1. Perkel DH, Gerstein GL, Moore GP. Neuronal spike trains and stochastic point processes II. Simultaneous spike trains. Biophys J. 1967;7:419–440. - PMC - PubMed
    1. Gerstein GL, Bedenbaugh P, Aertsen MH. Neuronal assemblies. IEEE Trans Biomed Eng. 1989;36:4–14. - PubMed
    1. Freiwald WA, Valdes P, Bosch J, Biscay R, Jimenez JC, et al. Testing non-linearity and directedness of interactions between neural groups in the macaque inferotemporal cortex. J Neurosci Methods. 1999;94:105–119. - PubMed

Publication types

MeSH terms