Comparative Study
. 2006 Nov 22;26(47):12206-18.
doi: 10.1523/JNEUROSCI.2813-06.2006.

Non-Gaussian membrane potential dynamics imply sparse, synchronous activity in auditory cortex

Affiliations
Comparative Study

Non-Gaussian membrane potential dynamics imply sparse, synchronous activity in auditory cortex

Michael R DeWeese et al. J Neurosci. .

Abstract

Many models of cortical dynamics have focused on the high-firing regime, in which neurons are driven near their maximal rate. Here we consider the responses of neurons in auditory cortex under typical low-firing rate conditions, when stimuli have not been optimized to drive neurons maximally. We used whole-cell patch-clamp recording in vivo to measure subthreshold membrane potential fluctuations in rat primary auditory cortex in both the anesthetized and awake preparations. By analyzing the subthreshold membrane potential dynamics on single trials, we made inferences about the underlying population activity. We found that, during both spontaneous and evoked responses, membrane potential was highly non-Gaussian, with dynamics consisting of occasional large excursions (sometimes tens of millivolts), much larger than the small fluctuations predicted by most random walk models that predict a Gaussian distribution of membrane potential. Thus, presynaptic inputs under these conditions are organized into quiescent periods punctuated by brief highly synchronous volleys, or "bumps." These bumps were typically so brief that they could not be well characterized as "up states" or "down states." We estimate that hundreds, perhaps thousands, of presynaptic neurons participate in the largest volleys. These dynamics suggest a computational scheme in which spike timing is controlled by concerted firing among input neurons rather than by small fluctuations in a sea of background activity.


Figures
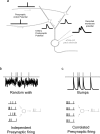
Figure 1.
Figure 1.
The dynamics of the membrane potential of a given cortical neuron in vivo provides a way of inferring activity among the network of neurons presynaptic to that neuron. a, In this simplified example, action potentials arriving at two synapses on the dendritic arbor of the recorded neuron each result in synaptic transmission, which in turn evokes a pair of unitary postsynaptic potentials. To a first approximation, the membrane potential of the cell is the sum of these two events, along with any other events that may have occurred. If the two synaptic events are nearly simultaneous, they can add and be seen as a single large event, whereas if they occurred at different times, they would be seen as two separate events. More generally, the degree to which spiking activity of the network of presynaptic afferents is correlated may be reflected in the dynamics of the recorded membrane potential. b, c, The same spike train can result from very dissimilar membrane potential dynamics. In b, the timing of each of the five spikes (top, gray) is determined by random, threshold-crossing fluctuations in the membrane potential (top, black) as it follows a highly stochastic, random walk that hovers just below the spike threshold, as one might expect if the synaptic inputs to the neuron are statistically independent of one another (bottom). In c, each spike from an identical spike train as in b results from tall bumps in the membrane potential, which would result if the synaptic inputs to the neuron were highly correlated in their activity (bottom).
Figure 2.
Figure 2.
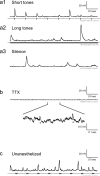
Membrane potential dynamics in auditory cortex do not resemble a random walk. a1, This 4 s example of a whole-cell patch-clamp recording from an auditory cortical neuron in vivo clearly exhibits the bumpy appearance ubiquitous in our dataset; QX-314, an intracellular fast sodium-channel blocker, was included in the patch pipette to prevent spiking as well as some other nonlinearities that can distort the relationship between synaptic activity and membrane potential. Throughout the trace, steeply rising peaks in the postsynaptic potentials follow most of the 65 dB, 25 ms tone pips (gray hash marks below the voltage trace; for stimulus protocol, see Materials and Methods), consistent with the occurrence of synchronous volleys of synaptic input. Aside from these narrow bumps, the membrane voltage remained close to the resting potential of the neuron. a2, These large excursions from rest were not restricted to stimulus transients. The stimulus here consisted of a 4-s-duration tone (gray bar beneath voltage trace), which began 15 ms following the far left of the trace. a3, Even in the absence of any auditory stimulation, the membrane potential displayed the same bumpy appearance, even long after the onset of the tone. b, As a control, we repeated these experiments after the topical application of TTX, a fast sodium channel blocker, to the cortical surface so as to abolish all presynaptic spiking and thus ensure the independence of synaptic events (see Materials and Methods, TTX application). As the expanded view of the trace demonstrates (bottom), the membrane potential does resemble a random walk in the absence of input correlations. We indicated two putative mEPSPs with asterisks. c, An example trace from an unanesthetized, head-restrained rat shows the same bumpy appearance as the records from anesthetized animals. The stimulus consisted of 100-ms-duration pure tones of 65 dB presented every 500 ms (gray hash marks below the voltage trace). Because QX-314 was not included in the patch pipette for this recording, the neuron sometimes fired action potentials. To allow comparison with the previous figures, we therefore median filtered [filter duration of 3 ms (Jagadeesh et al., 1997)] the trace to remove three spikes.
Figure 3.
Figure 3.
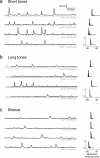
Throughout the neuronal population, membrane potential time courses looked “bumpy” under all stimulus conditions tested. Four-second-duration whole-cell records obtained during the presentation of 25-ms-duration tones (a, gray hash marks below traces), 4-s-duration tones (b; gray bar below traces), and silence (c) all display well isolated bumps superimposed on otherwise flat traces sitting at the resting potential of each neuron. For each record, the frequency histogram of membrane potential appears to the right of the corresponding trace; histograms are normalized to unit height, and the membrane potential values are uncorrected for the junction potential. Note the long tail and sharp peak of every distribution. Each of the 12 traces was recorded from a different neuron.
Figure 4.
Figure 4.
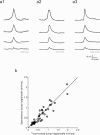
Stimulus-evoked postsynaptic potentials (or bumps) were very similar in shape to bumps that occurred spontaneously. a1, For this neuron, each trace corresponds to the membrane potential averaged across either stimulus-evoked (gray traces) or spontaneous (black traces) bumps with peak heights falling between 5 and 10 mV (bottom pair of traces), 10 and 20 mV (second from bottom), 20 and 30 mV (third from bottom), or 30 and 40 mV (top pair of traces). The gray and black traces are nearly identical for each of the four pairs. Bumps were identified as every excursion of the membrane potential exceeding a 5 mV threshold above the resting potential of a neuron. Bumps with peaks occurring between 10 and 100 ms after stimulus onset were classified as stimulus evoked, and all others were classified as spontaneous; this neuron was recorded during the short-tone protocol, which consisted of 25-ms-duration tone pips. Bumps were aligned horizontally based on the times of their peaks. a2, a3, Same format as a1 for two other neurons. b, For each neuron in the population, stimulus-evoked bumps were similar in shape to spontaneous bumps, as indicated by the high correlation between the ratio of height to width (full-width at half-maximum) of spontaneous versus tone-evoked bumps (correlation coefficient of 0.94), and the fact that all points lie close to the diagonal line indicating equality. Each point in the scatter plot corresponds to 1 of 17 neurons and 1 of the 4 peak height categories defined in a1 [n = (17 neurons)(1–4 peak height categories) = 44 points] For any given neuron, only those peak height categories containing at least one spontaneous and at least one tone-evoked bump were included in the analysis.
Figure 5.
Figure 5.
The random walk model does not capture the key features of the data unless we introduce correlations among the presynaptic inputs. b shows an example trace generated by the excitation only model (see text and Materials and Methods, Random walk model) that takes only excitatory input that is fit to the mean of the data trace shown in a (replotted from Fig. 2a1). The model trace looks nothing like the original. c, By including inhibitory inputs to the model (E&I model), we can fit both the mean and the variance of the data trace, but the fluctuations in the model do not have the same bumpy character as the data. d, Allowing the model parameters to slowly vary on a 200 ms timescale (Rate Modulated E&I model) still does not capture the structure evident in the data. e, Fitting the mean and variance of the model to the data trace on a fast, 10 ms timescale greatly improves the performance of the model, but it still makes errors during abrupt changes in the membrane potential, such as the downward swings that often occur at the onsets of steeply rising bumps in the data (expanded view, bottom), unless we impose additional correlations between the inhibitory and excitatory inputs (data not shown).
Figure 6.
Figure 6.
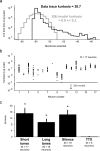
The random walk model is inconsistent with membrane potential dynamics across the neural population. a, A histogram of membrane potential values (black line) taken from the example trace shown in Figures 2a1 and 5a exhibits much more weight both at its peak (approximately −60 mV) and in its tail (more than approximately −50 mV) than the Gaussian-distributed histogram (thick gray line) corresponding to the example trace plotted in Figure 5c generated by the E&I model fit to the same mean and variance (note the logarithmic scale of the ordinate). We quantified the difference in histogram shape with the kurtosis (see Materials and Methods, Kurtosis), which is always 0 for the E&I model, and >0 for otherwise flat traces containing tall, well isolated bumps. For this example, the data trace has a kurtosis of 30.7, whereas for traces drawn from the random walk model, kurtosis was 0.0 ± 0.2 (mean ± SD). b, Across the population of 17 neurons responding to the short-tone protocol, the kurtoses of individual traces (black points) were large and positive (note logarithmic scale) compared with the range of values corresponding to the random walk model; the gray line indicates 1 SD above 0, which is the mean value for the model. c, Across the population, the kurtosis was high for short tones (15.2 ± 3.5; n = 17 neurons; all quantities are mean ± SE unless otherwise specified), long tones (9.5 ± 2.2; n = 18 neurons), and even silence (14.4 ± 3.0; n = 18 neurons), but it was consistent with the random walk model when input correlations were removed through the application of TTX to the cortical surface (kurtosis of 0.2 ± 0.3; n = 6 neurons; asterisks denote mean values significantly different from zero according to a single sample Student's t test for p < 0.01) (see Materials and Methods, TTX application).
Figure 7.
Figure 7.
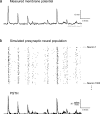
How many presynaptic action potentials give rise to a typical synchronous volley? To get an order-of-magnitude estimate of the collective firing rate of the presynaptic population, we used a simple model that relied on previous measurements of the relationship between membrane potential and synaptic conductance (Wehr and Zador, 2003) and mEPSC size (Stevens and Zador 1998; Gil et al., 1999) (see Materials and Methods, Estimation of the presynaptic firing rate). To a first approximation, we estimate that the collective firing rate of the excitatory presynaptic population approximately follows the same time course as the recorded membrane potential itself, with ∼3.3 mEPSCs occurring every millisecond for every millivolt above rest in the whole-cell record. For example, the 15-mV-tall bump in the membrane potential (a; same trace as in Figs. 2a1, 5a) occurring ∼1.5 s before the end of the trace, corresponds to ∼50 mEPSCs per millisecond at its peak. Assuming that the probability of vesicle release, p, is close to 1, this is consistent with ∼50 spikes/ms from excitatory presynaptic fibers, which corresponds to ∼1000 spikes over the entire volley. Assuming that these spikes are equally distributed across 10,000 presynaptic neurons (Braitenberg and Schuz, 1998), we simulated spike rasters for 1000 of these neurons (b, top) and plotted the peristimulus time histogram (PSTH) for the full population (bottom). Note that this does not include any inhibitory inputs, which play as significant a role as the excitatory inputs near the peaks of the larger bumps (Wehr and Zador, 2003), and that these estimated spike rates may well be underestimates if p is actually <1, as it is often reported to be (Castro-Alamancos and Connors, 1997; Dobrunz and Stevens, 1997; Huang and Stevens, 1997; Murthy et al., 1997).

References

    1. Aertsen A, Diesmann M, Gewaltig MO. Propagation of synchronous spiking activity in feedforward neural networks. J Physiol (Paris) 1996;90:243–247. - PubMed
    1. Anderson J, Lampl I, Reichova I, Carandini M, Ferster D. Stimulus dependence of two-state fluctuations of membrane potential in cat visual cortex. Nat Neurosci. 2000;3:617–621. - PubMed
    1. Atzori M, Lei S, Evans DI, Kanold PO, Phillips-Tansey E, McIntyre O, McBain CJ. Differential synaptic processing separates stationary from transient inputs to the auditory cortex. Nat Neurosci. 2001;4:1230–1237. - PubMed
    1. Azouz R, Gray CM. Cellular mechanisms contributing to response variability of cortical neurons in vivo. J Neurosci. 1999;19:2209–2223. - PMC - PubMed
    1. Bair W, Koch C. Temporal precision of spike trains in extrastriate cortex of the behaving macaque monkey. Neural Comput. 1996;8:1185–1202. - PubMed

Publication types

MeSH terms

LinkOut - more resources