Clinical Trial
. 2007 Feb;97(2):1621-32.
doi: 10.1152/jn.00745.2006. Epub 2006 Nov 22.

Reward value coding distinct from risk attitude-related uncertainty coding in human reward systems

Affiliations
Clinical Trial

Reward value coding distinct from risk attitude-related uncertainty coding in human reward systems

Philippe N Tobler et al. J Neurophysiol. 2007 Feb.

Abstract

When deciding between different options, individuals are guided by the expected (mean) value of the different outcomes and by the associated degrees of uncertainty. We used functional magnetic resonance imaging to identify brain activations coding the key decision parameters of expected value (magnitude and probability) separately from uncertainty (statistical variance) of monetary rewards. Participants discriminated behaviorally between stimuli associated with different expected values and uncertainty. Stimuli associated with higher expected values elicited monotonically increasing activations in distinct regions of the striatum, irrespective of different combinations of magnitude and probability. Stimuli associated with higher uncertainty (variance) elicited increasing activations in the lateral orbitofrontal cortex. Uncertainty-related activations covaried with individual risk aversion in lateral orbitofrontal regions and risk-seeking in more medial areas. Furthermore, activations in expected value-coding regions in prefrontal cortex covaried differentially with uncertainty depending on risk attitudes of individual participants, suggesting that separate prefrontal regions are involved in risk aversion and seeking. These data demonstrate the distinct coding in key reward structures of the two basic and crucial decision parameters, expected value, and uncertainty.


Figures
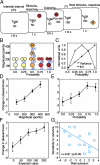
FIG. 1.
FIG. 1.
Experimental design and pleasantness ratings. A: behavioral task. Single stimuli were presented randomly in 1 of the 4 quadrants of a monitor for 1.5 s, and participants indicated the quadrant in which stimuli appeared with a button press. Stimuli were associated with different combinations of reward magnitude and probability (see B). Reward consisted of points, 4% of which was paid out as British pence to subjects at the end of the experiment. Throughout the experiment, the total of points accumulated was displayed and updated after reward delivery. Trial types alternated randomly. B: experimental design. Twelve different stimuli were associated with different reward magnitudes (ordinate) and probabilities (abscissa) as shown. Expected value of stimuli (sum of probability-weighted magnitudes) is indicated below stimuli and increases with distance from origin. We disentangled expected value from magnitude and probability by associating different stimuli with the same expected value but different combinations of magnitude and probability. C: relation of expected value (EV) and uncertainty (measured as variance) to probability. D–F: average change in pleasantness rating in all participants as a function of magnitude (D), probability (E), and expected value (F; 16 participants, error bars represent SE). The scale ranged from –5 (very unpleasant) to +5 (very pleasant). Table 1 shows absolute ratings before and after experiment. G: sensitivity of change in pleasantness as function of risk attitude. Risk attitudes were determined in independent choice trials (16 participants). Sensitivity was determined as slope in pleasantness change against the variance of the binary probability distribution associated with each stimulus.
FIG. 2.
FIG. 2.
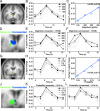
Coding of reward magnitude and probability in striatum. A: activation in caudate covarying with increasing reward magnitude (peak at –12/2/6; Table 2, top). B: time courses of responses to stimuli associated with different reward magnitudes, averaged across 16 participants. C: regression of averaged activation on magnitude (16 participants). Activations are further averaged across 2nd and 3rd (peak) time points shown in B. D—F: same as A–C but with time courses separated according to reward being delivered or not. G: activation in ventral striatum covarying with increasing probability (peak at –10/4/−4; Table 2, middle). H: time courses of responses to stimuli associated with different probabilities, averaged across 16 participants. I: regression of average activation on probability (16 participants). Activations are further averaged across 2nd and 3rd (peak) time points shown in H. J–K: same as G–I but with time courses separated according to reward being delivered or not. In this and all other figures, the right side of the image corresponds to the right side of the brain and circles around activations serve as visual aid.
FIG. 3.
FIG. 3.
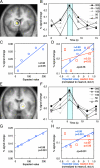
Coding of different expected reward values in striatum. A and E: stronger activations in caudate close to internal capsule (A) and posterior striatum (E) to stimuli associated with higher expected reward value (peaks at –8/12/6 and 16/−6/4; Table 2, bottom). B and F: time courses of increasing responses to stimuli associated with increasing expected value, averaged across 16 participants. C and G: regression of peak activations on expected value (shaded areas in B and F, respectively). D and H: dissociation of coding of expected value in areas shown in A and E, respectively, from behavioral reaction time (data in D and H replotted from C and G, respectively). Abscissas were centered according to means of expected value and reaction time and scaled to SD to facilitate comparisons. Differences in regressions in D were insignificant for dorsal striatal region shown in A, but regressions in H were significant for ventral striatum shown in E.
FIG. 4.
FIG. 4.
Coding of expected reward value irrespective of magnitude and probability in striatum. A: striatal activation to different pairs of stimuli with same expected value. For each pair, peak activations differed insignificantly (shaded areas) despite different magnitude-probability combinations for the same expected value (mean difference between activations within pairs <0.004% signal change, P > 0.78). However, activations varied across expected values (left to right; ANOVA P < 0.01). B: coding of magnitude and probabilty in striatal region marked by circle in Fig. 3A. Probability was constant at P = 0.5 for variations in magnitude, and magnitude was constant at an average 150 points for variations in probability (mean of 100 and 200 points with equal numbers). C: separate but partly overlapping striatal regions that show increased activations with increasing reward magnitude (r = 0.98, P < 0.05), probability (r = 0.99, P < 0.01) and expected value (r = 0.90, P < 0.05), respectively. D: lack of correlation between striatal activations and variance.
FIG. 5.
FIG. 5.
Coding of magnitude, probability and expected value in lateral prefrontal cortex. Common and distinct increases in activation to stimuli associated with increasing reward magnitude, probability and expected value as indicated by different colors (r = 0.84, P = 0.09; Table 2).
FIG. 6.
FIG. 6.
Differential coding of reward uncertainty but not expected value in lateral orbitofrontal cortex. A: stronger activation to stimuli associated with higher variance as revealed by general linear model searching for inverted U relation of activation to probability (peak at –42/30/−20). B: time courses of increasing responses to stimuli associated with increasing variance, averaged across 16 participants. C and D: significant correlations of average peak activation with variance (C) but not expected value (D; shaded area in B).
FIG. 7.
FIG. 7.
Relation of uncertainty-related orbitofrontal activations to individual risk attitudes. A–C: covariation in lateral orbitofrontal cortex with increasing risk aversion across participants (peak at 36/46/−16). The contrast estimates (betas) of individual participants are regressed against risk aversion in B and compared by averaged bar plots in C (P < 0.001; unpaired t-test in 7 risk seekers and 6 risk averters). D–F: covariation in medial orbitofrontal cortex with risk-seeking (= inverse relation to risk aversion; peak at –10/52/−2). E and F: risk correlations in analogy to B and C. Abscissa shows risk aversion as expressed by preference factors (−4 most risk-seeking, +4 most risk aversion). To obtain these graphs, we correlated the uncertainty-related activations to individual risk attitude in 2 steps. First, we determined in each participant the contrast estimates (beta) reflecting the goodness of fit between the brain activations and the uncertainty defined by the 5 probabilities used (variance as inverted U function of probability). Then we regressed the obtained contrast estimates (beta) of all participants to their individual risk preference factors assessed behaviorally and searched for brain areas showing positive (A) or negative correlations (D). We visualized the correlations with risk aversion by plotting the regressions with the betas in B and E.
FIG. 8.
FIG. 8.
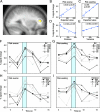
Combined coding of reward value and uncertainty. A: middle prefrontal region showing significant correlation with a differential expected value-variance model (peak at 32/44/10). The model assumed covariation with expected value and variance (1st level) and in addition positive covariation with expected value and higher variance-coding slopes for risk seekers compared with risk averters (2nd level). B and C: correlations of signal change with expected value separately for 6 risk-averse participants and 7 risk seekers. The difference in slope was not significant (P > 0.47). D and E: significantly different correlations of signal change with variance depending on risk aversion (6 participants; D) or risk seekers (7 participants; E) as assessed by behavioral preferences. Individual data points in b-e are from peak changes of responses (shaded areas in F–I). F and G: time courses of activations with expected value in 6 risk-averse participants (F) and 7 risk seekers (G). H and I: time courses of activations with variance in 6 risk-averse participants (H) and 7 risk seekers (I).
FIG. 9.
FIG. 9.
Reward value coding combined with differential uncertainty coding according to individual risk attitude. A–E: differential prefrontal uncertainty coding in risk-averse participants. A: region in superior frontal gyrus showing selective decreased activation with variance in 6 risk averters without variance coding in seven risk seekers (peak at 18/62/10). B–E: correlations of signal change with expected value and variance. F–J: differential prefrontal uncertainty coding in risk-seeking participants. F: region in inferior frontal gyrus showing selective increased activation with variance in 7 risk seekers without variance coding in 6 risk averters (peak at 48/22/8). G–J: correlations of signal change with expected value and variance. Same regression model for A and F as used for Fig. 8.

References

    1. Aron AR, Shohamy D, Clark J, Myers C, Gluck MA, Poldrack RA. Human midbrain sensitivity to cognitive feedback and uncertainty during classification learning. J Neurophysiol 92: 1144–1152, 2004. - PubMed
    1. Bechara A, Damasio H, Damasio AR. Emotion, decision-making and the orbitofrontal cortex. Cereb Cortex 10: 295–307, 2000. - PubMed
    1. Bechara A, Damasio AR, Damasio H, Anderson SW. Insensitivity to future consequences following damage to human prefrontal cortex. Cognition 50: 7–15, 1994. - PubMed
    1. Bernoulli D Exposition of a new theory on the measurement of risk (translated from Latin). Econometrica 22: 23–36, 1954.
    1. Bolla KI, Eldreth DA, Matochik JA, Cadet JL. Neural substrates of faulty decision-making in abstinent marijuana users. Neuroimage 26: 480–492, 2005. - PubMed

Publication types

MeSH terms