Operon prediction for sequenced bacterial genomes without experimental information
- PMID: 17122389
- PMCID: PMC1800777
- DOI: 10.1128/AEM.01686-06
Operon prediction for sequenced bacterial genomes without experimental information
Abstract
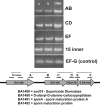
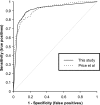
Various computational approaches have been proposed for operon prediction, but most algorithms rely on experimental or functional data that are only available for a small subset of sequenced genomes. In this study, we explored the possibility of using phylogenetic information to aid in operon prediction, and we constructed a Bayesian hidden Markov model that incorporates comparative genomic data with traditional predictors, such as intergenic distances. The prediction algorithm performs as well as the best previously reported method, with several significant advantages. It uses fewer data sources and so it is easier to implement, and the method is more broadly applicable than previous methods--it can be applied to essentially every gene in any sequenced bacterial genome. Furthermore, we show that near-optimal performance is easily reached with a generic set of comparative genomes and does not depend on a specific relationship between the subject genome and the comparative set. We applied the algorithm to the Bacillus anthracis genome and found that it successfully predicted all previously verified B. anthracis operons. To further test its performance, we chose a predicted operon (BA1489-92) containing several genes with little apparent functional relatedness and tested their cotranscriptional nature. Experimental evidence shows that these genes are cotranscribed, and the data have interesting implications for B. anthracis biology. Overall, our findings show that this algorithm is capable of highly sensitive and accurate operon prediction in a wide range of bacterial genomes and that these predictions can lead to the rapid discovery of new functional relationships among genes.
Figures


References
-
- Bockhorst, J., M. Craven, D. Page, J. Shavlik, and J. Glasner. 2003. A Bayesian network approach to operon prediction. Bioinformatics 19:1227-1235. - PubMed
-
- Bockhorst, J., Y. Qiu, J. Glasner, M. Liu, F. Blattner, and M. Craven. 2003. Predicting bacterial transcription units using sequence and expression data. Bioinformatics 19(Suppl. 1):i34-i43. - PubMed
Publication types
MeSH terms
Substances
Grants and funding
LinkOut - more resources
Full Text Sources
Molecular Biology Databases

