

Usefulness of texture analysis for computerized classification of breast lesions on mammograms
- PMID: 17122993
- PMCID: PMC3043897
- DOI: 10.1007/s10278-006-9945-8
Usefulness of texture analysis for computerized classification of breast lesions on mammograms
Abstract
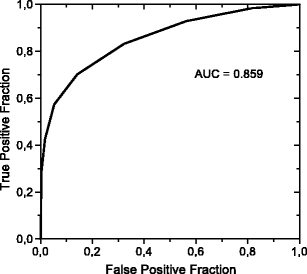
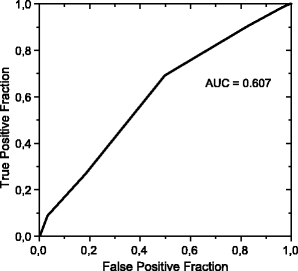
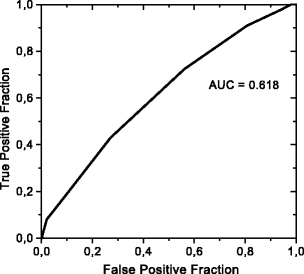
This work presents the usefulness of texture features in the classification of breast lesions in 5,518 images of regions of interest, which were obtained from the Digital Database for Screening Mammography that included microcalcifications, masses, and normal cases. Sixteen texture features were used, i.e., 13 were based on the spatial gray-level dependence matrix and 3 on the wavelet transform. The nonparametric K-NN classifier was used in the classification stage. The results obtained from receiver operating characteristic analysis indicated that the texture features can be used for separating normal regions and lesions with masses and microcalcifications, yielding the area under the curve (AUC) values of 0.957 and 0.859, respectively. However, the texture features were not very effective for distinguishing between malignant and benign lesions because the AUC was 0.617 for masses and 0.607 for microcalcifications. The study showed that the texture features can be used for the detection of suspicious regions in mammograms.
Figures


Similar articles
-
Breast cancer diagnosis: analyzing texture of tissue surrounding microcalcifications.IEEE Trans Inf Technol Biomed. 2008 Nov;12(6):731-8. doi: 10.1109/TITB.2008.920634. IEEE Trans Inf Technol Biomed. 2008. PMID: 19000952
-
Computerized characterization of masses on mammograms: the rubber band straightening transform and texture analysis.Med Phys. 1998 Apr;25(4):516-26. doi: 10.1118/1.598228. Med Phys. 1998. PMID: 9571620
-
Computerized analysis of mammographic microcalcifications in morphological and texture feature spaces.Med Phys. 1998 Oct;25(10):2007-19. doi: 10.1118/1.598389. Med Phys. 1998. PMID: 9800710
-
Texture analysis of tissue surrounding microcalcifications on mammograms for breast cancer diagnosis.Br J Radiol. 2007 Aug;80(956):648-56. doi: 10.1259/bjr/30415751. Epub 2007 Jul 9. Br J Radiol. 2007. PMID: 17621604
-
Potential usefulness of similar images in the differential diagnosis of clustered microcalcifications on mammograms.Radiology. 2009 Dec;253(3):625-31. doi: 10.1148/radiol.2533090373. Epub 2009 Sep 29. Radiology. 2009. PMID: 19789245
Cited by
-
Thick slices from tomosynthesis data sets: phantom study for the evaluation of different algorithms.J Digit Imaging. 2009 Oct;22(5):519-26. doi: 10.1007/s10278-007-9075-y. Epub 2007 Oct 23. J Digit Imaging. 2009. PMID: 17955296 Free PMC article.
-
An optimal transportation approach for nuclear structure-based pathology.IEEE Trans Med Imaging. 2011 Mar;30(3):621-31. doi: 10.1109/TMI.2010.2089693. Epub 2010 Oct 25. IEEE Trans Med Imaging. 2011. PMID: 20977984 Free PMC article.
-
Detection and classification of thyroid follicular lesions based on nuclear structure from histopathology images.Cytometry A. 2010 May;77(5):485-94. doi: 10.1002/cyto.a.20853. Cytometry A. 2010. PMID: 20099247 Free PMC article.
-
Identification of masses in digital mammogram using gray level co-occurrence matrices.Biomed Imaging Interv J. 2009 Jul;5(3):e17. doi: 10.2349/biij.5.3.e17. Epub 2009 Jul 1. Biomed Imaging Interv J. 2009. PMID: 21611053 Free PMC article.
-
Classification of mammogram using two-dimensional discrete orthonormal S-transform for breast cancer detection.Healthc Technol Lett. 2015 Mar 31;2(2):46-51. doi: 10.1049/htl.2014.0108. eCollection 2015 Apr. Healthc Technol Lett. 2015. PMID: 26609404 Free PMC article.
References
-
- Zuckerman HC. The role of mammogaphy in the diagnosis of breast cancer. In: Ariel IM, Cleary JB, editors. Breast Cancer: Diagnosis and Treatment. New York: McGraw-Hill; 1987. pp. 152–172.
-
- Tabar L, Dean PB. The control of breast cancer through mammography screening. Radiol Clin North Am. 1987;25:961. - PubMed
-
- Thurfjell E, Lervenall K, Taube A. Benefit of independent double reading in a population-based mammography screening program. Radiology. 1994;191:241–244. - PubMed
-
- Birdwell R, Ikeda D, O'Shaughnessy K, Sickles E. Mammographic characteristics of 115 missed cancers later detected with screening mammography and the potential utility of computer-aided detection. Radiology. 2000;219:192–202. - PubMed
-
- Kegelmeyer WP, Pruneda JM, Bourland PD, Hillis A, Riggs MW, Nipper ML. Computer aided mammographic screening for spiculated lesions. Radiology. 1994;191:331–337. - PubMed
Publication types
MeSH terms
LinkOut - more resources
Full Text Sources
Medical
