. 2007 Jan;16(1):20-9.
doi: 10.1110/ps.062393707. Epub 2006 Nov 22.

The effects of cosolutes on protein dynamics: the reversal of denaturant-induced protein fluctuations by trimethylamine N-oxide

Affiliations

The effects of cosolutes on protein dynamics: the reversal of denaturant-induced protein fluctuations by trimethylamine N-oxide

Vicky Doan-Nguyen et al. Protein Sci. 2007 Jan.

Abstract

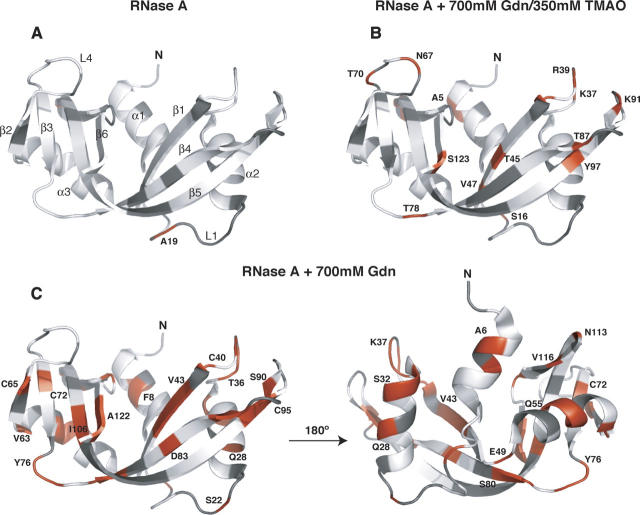
The protein stabilizing effects of the small molecule osmolyte, trimethylamine N-oxide, against chemical denaturant was investigated by NMR spin-relaxation measurements and model-free analysis. In the presence of 0.7 M guanidine hydrochloride increased picosecond-nanosecond dynamics are observed in the protein ribonuclease A. These increased fluctuations occur throughout the protein, but the most significant increases in flexibility occur at positions believed to be the first to unfold. Addition of 0.35 M trimethylamine N-oxide to this destabilized form of ribonuclease results in significant rigidification of the protein backbone as assessed by (1)H-(15)N order parameters. Statistically, these order parameters are the same as those measured in native ribonuclease indicating that TMAO reduces the amplitude of backbone fluctuations in a destabilized protein. These data suggest that TMAO restricts the bond vector motions on the protein energy landscape to resemble those motions that occur in the native protein and points to a relation between stability and dynamics in this enzyme.


Figures

Scheme 1.
Scheme 1.
Chemical structure of trimethylamine N-oxide
Figure 1.
Figure 1.
Thermal denaturation of RNase A. The molar ellipticity at 222 nm was monitored by circular dichroism spectroscopy for 20 μM native RNase A (•), 15 μM RNase A + 700 mM guanidine hydrochloride (▾), and 20 μM RNase A + 700 mM guanidine hydrochloride + 350 mM TMAO (♦).
Figure 2.
Figure 2.
Residue-specific NMR spin-relaxation rates. Longitudinal (R 1) (A) and transverse (R 2) (B) relaxation rates and the steady-state heteronuclear NOE (C) are shown as a function of the RNase A primary sequence for native RNase A (black circles), RNase A + 700 mM guanidine hydrochloride (red circles), and RNase A + 700 mM guanidine hydrochloride + 350 mM TMAO (blue circles). The location of secondary structure elements is shown at the top of the figure.
Figure 3.
Figure 3.
Residue specific order parameters (S 2). (A–C) S 2 values as a function of RNase A primary sequence for native RNase A (black circles), RNase A + 700 mM guanidine hydrochloride (red circles), and RNase A + 700 mM guanidine hydrochloride + 350 mM TMAO (blue circles). The location of secondary structure elements is shown at the top of the figure. Black, blue, and red horizontal dashed lines show the protein-wide average S 2 value for native, RNaseA/Gdn/TMAO, and RNase A/Gdn samples, respectively.
Figure 4.
Figure 4.
Structural context of RNase A backbone dynamics. Residues in RNase A in which an internal correlation time (τe) is part of the model-free dynamics analysis are colored red on the illustration of RNase A. (A) Data for native RNase A, (B) RNase A + 700 mM guanidine hydrochloride + 350 mM TMAO, and (C) RNase A + 700 mM guanidine hydrochloride. The two panels in C are related by 180° rotation. For aid in viewing, selected residues are labeled with the one-letter amino acid code; in A, 2° structure elements are identified to orient the reader. Residues in gray are those that were not analyzed, including proline, overlapped residues, or those with low signal-to-noise values. The figure was prepared with the program MacPyMOL (DeLano 2005).
Figure 5.
Figure 5.
Guanidine-induced changes in protein backbone dynamics. Regions of RNase A in which backbone dynamics show the largest statistical difference from native RNase A (by t-test,Table 2) are colored black. Statistically significant differences are those in which p < 0.05 (Devore 2000). The figure was prepared with the program MacPyMOL (DeLano 2005).

References

    1. Abragam, A. 1961. Principles of nuclear magnetism. Clarendon Press, Oxford, UK.
    1. Akke, M., Brüschweiler, R., and Palmer, A.G. 1993. NMR order parameters and free energy: An analytic approach and application to cooperative Ca2+ binding by calbindin D9k . J. Am. Chem. Soc. 115: 9832–9833.
    1. Anderson, D.G., Hammes, G.G., and Walz Jr., F.G. 1968. Binding of phosphate ligands to ribonuclease A. Biochemistry 7: 1637–1645. - PubMed
    1. Arakawa, T. and Timasheff, S.N. 1985. The stabilization of proteins by osmolytes. Biophys. J. 47: 411–414. - PMC - PubMed
    1. Athawale, M.V., Dordick, J.S., and Garde, S. 2005. Osmolyte trimethylamine-N-oxide does not affect the strength of hydrophobic interactions: Origin of osmolyte compatibility. Biophys. J. 89: 858–866. - PMC - PubMed

Publication types

LinkOut - more resources