Comparative Study
. 2006 Dec 5;103(49):18769-74.
doi: 10.1073/pnas.0605238103. Epub 2006 Nov 21.

NMDA receptor surface mobility depends on NR2A-2B subunits

Affiliations
Comparative Study

NMDA receptor surface mobility depends on NR2A-2B subunits

Laurent Groc et al. Proc Natl Acad Sci U S A. .

Abstract

The NR2 subunit composition of NMDA receptors (NMDARs) varies during development, and this change is important in NMDAR-dependent signaling. In particular, synaptic NMDAR switch from containing mostly NR2B subunit to a mixture of NR2B and NR2A subunits. The pathways by which neurons differentially traffic NR2A- and NR2B-containing NMDARs are poorly understood. Using single-particle and -molecule approaches and specific antibodies directed against NR2A and NR2B extracellular epitopes, we investigated the surface mobility of native NR2A and NR2B subunits at the surface of cultured neurons. The surface mobility of NMDARs depends on the NR2 subunit subtype, with NR2A-containing NMDARs being more stable than NR2B-containing ones, and NR2A subunit overexpression stabilizes surface NR2B-containing NMDARs. The developmental change in the synaptic surface content of NR2A and NR2B subunits was correlated with a developmental change in the time spent by the subunits within synapses. This suggests that the switch in synaptic NMDAR subtypes depends on the regulation of the receptor surface trafficking.


Conflict of interest statement

The authors declare no conflict of interest.

Figures
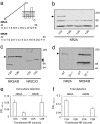
Fig. 1.
Fig. 1.
Characterization of anti-NR2A and anti-NR2B antibodies. (a) Peptide sequences from the N-terminal domain of NR2A (44–58) and NR2B (42–60) subunits used to raise antibodies. (b) HEK293 cells were transfected with either NR1/NR2A, NR1/NR2B, NR1/NR2C, or NR1/NR2D subunit cDNAs. Cells were analyzed by immunoblotting with an anti-NR2A (44–58) antibody. Note the specific detection of NR2A subunit (arrow). (c) Using the same method as in b, NR2A, NR2B, NR2C, or NR2D subunit was detected by using either an anti-NR2A antibody (1454–1464) that recognizes both NR2A (Mr 180 kDa) and NR2B (Mr 180 kDa) subunits (left arrowhead in lanes 1 and 2) or an anti-NR2D antibody (1307–1323) that recognizes both NR2C (Mr 135 kDa, right lower arrowhead) and NR2D (150 kDa, right upper arrowhead) (lanes 3 and 4). The positions of molecular mass standards (kDa) are shown on the right. (d) P2 fractions were prepared from whole brain (15 μg of wet weight tissue applied per gel lane) of either wild-type (WT) or NR2A (−/−) mice and analyzed by immunoblotting with anti-NR2A (44–58) or anti-NR2A (1454–1464) antibodies. In lane 2, note that the anti-NR2A (44–58) antibody does not recognize an immunoreactive species in the P2 fractions prepared from NR2A (−/−) mice. (e and f) HEK293 cells were transfected with either NR1/NR2A or NR1/NR2B NMDA receptor subunit cDNAs and cell surface ELISAs carried out by using either anti-NR2A (44–58) or anti-NR2B (42–60) antibodies as indicated. It can be seen that anti-NR2A (44–58) antibodies recognize only cell surface-expressed NR2A subunits and anti-NR2B (42–60), NR2B subunits only (means ± SD for triplicate values, n = 3).
Fig. 2.
Fig. 2.
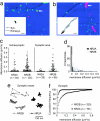
Differential membrane diffusion of NR2A- and NR2B-containing NMDARs at the surface of D15 neurons. (a and b) Representative summed trajectories of QD coupled to NR2A- (a) and NR2B-containing (b) NMDARs. The green spots represent synaptic sites labeled with Mitotracker. The red traces represent the trajectory of QD–NR2 subunit complexes, with immobile complexes being exemplified by dot-like trajectory, whereas diffusing complexes are represented by extended line trajectories. (c) Scatter plot distributions of the instantaneous diffusion coefficient of NR2A- and NR2B-containing NMDARs in the extrasynaptic (Left) and the synaptic area (Right). The bar in each group represents the median value. (d) Superimposed distribution histograms of the instantaneous diffusion coefficient of NR2A- (filled bars) and NR2B- (hatched gray bars) containing NMDARs. Note the overlap for the low diffusion coefficients. (e) Examples of NR2A- (filled dots, full line) and NR2B-containing NMDAR (open dots, broken line) trajectories obtained by single-molecule approach within synapses (Scale bar: 150 nm.) (f) Cumulative distributions of the instantaneous diffusion coefficient of synaptic NR2A- (filled dots) and NR2B-containing (open dots) NMDARs. The first point of the distributions corresponds to the percentage of immobile receptors (bin size = 0.0075 μm2/s). Note the higher percentage of immobile synaptic NR2A- (83%) when compared with NR2B-containing (59%) NMDARs.
Fig. 3.
Fig. 3.
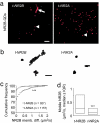
Overexpression of NR2A subunit affect the surface diffusion of NR2B-containing NMDARs in days in vitro 10–15 hippocampal-cultured neurons. (a) Representative summed trajectories of QDs coupled to NR2B-containing NMDAR (red traces) recorded at the surface of transfected neurons by SEP-NR2B (Left) or SEP-NR2A (Right). QDs were only tracked at the somatic surface of SEP-NR-positive neurons to ensure that only NR2-overexpressing neurons were analyzed. Typical immobile trajectory of NR2B-containing NMDAR are indicated by arrowheads, whereas a diffusing NR2B-containing NMDAR is pointed out by an arrow line. (Scale bar: 1 μm.) (b) Examples of NR2B-containing NMDAR from SEP-NR2B-positive (Left, open circle) or SEP-NR2A-positive (Right, filled circle) neurons. (Scale bar: 175 nm.) (c) Cumulative distributions of the instantaneous diffusion coefficient of surface NR2B-containing NMDARs from neurons overexpressing either NR2B (NR2B t, open circle) or NR2A (NR2A t, filled circle) subunits (bin size = 0.075 μm2/s). The NR2B-containing NMDAR surface diffusion was reduced significantly in neurons overexpressing NR2A subunits (∗∗∗, P < 0.001, Mann–Whitney test). (d) The surface diffusion of mobile NR2B-containing NMDARs was significantly slower in NR2A-overexpressing neurons when compared with NR2B overexpressing ones (∗∗∗, P < 0.001, Mann–Whitney test).
Fig. 4.
Fig. 4.
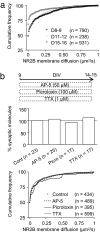
The surface diffusion of NR2B-containing NMDARs decreases overdevelopment in an activity-independent manner. (a) Cumulative distributions of the instantaneous diffusion coefficient of extrasynaptic NR2B-containing NMDAR at three developmental stages: days in vitro (D)8–9 (open dots), D11–12 (gray dots), and D15–16 (dark gray dots) neurons. The first point of the distributions corresponds to the percentage of immobile receptors (bin size = 0.0075 μm2/s). Note the significant diffusion decreases at D15–16 when compared with D8–9 (P < 0.001, Kolmogorov–Smirnov test). (b) Chronic treatments with AP5, tetrodotoxin (TTX), or picrotoxin were applied from D9 to D15 (Top) to block the global neuronal activity. None of these treatments affected the surface distribution of NR2B-containing NMDARs, as shown by the percent of synaptic molecules in all conditions (P > 0.05, n = number of dendritic fields examined) (Middle). The membrane diffusion distributions in all conditions were statistically not different (Bottom).
Fig. 5.
Fig. 5.
Exchange rate and synaptic dwell-time of NR2B-containing NMDARs overdevelopment. (a) Surface trajectory of two NR2B-containing NMDARs at D8 and D15. The NMDARs exchanged between the synaptic (black line) and extrasynaptic (gray line) membrane compartments. (Scale bar: 300 nm.) Recordings of the NR2B-containing NMDAR compartment localization over time at D8 and D15. In these two examples, the NR2B-containing NMDARs exchange approximately three to four times between the synaptic (Syn) and extrasynaptic (Ext) compartments during the 35- to 40-s recording. (b) Exchange rate (mean ± SEM, Hertz) between the extrasynaptic and synaptic compartments was calculated for NR2B-containing NMDARs at D8 (n = 17) and D15 (n = 18). (c) Synaptic residency time of exchanging NR2A- (n = 18) and NR2B-containing NMDARs was measured and compared overdevelopment (mean ± SEM, seconds). Note the significant decrease for NR2B-containing NMDARs overdevelopment. At mature stages, the synaptic residency time of NR2A-containing NMDARs was similar as the one of NR2B-containing NMDARs at immature stages. (d) Schematic representation of the regulation of NR2A- and NR2B-containing NMDAR surface diffusion over neuronal maturation. The synapse is represented by the presynaptic element (open triangle) and the postsynaptic density (filled bar).

References

    1. Sheng M, Cummings J, Roldan LA, Jan YN, Jan LY. Nature. 1994;368:144–147. - PubMed
    1. Wenthold RJ, Prybylowski K, Standley S, Sans N, Petralia RS. Annu Rev Pharmacol Toxicol. 2003;43:335–358. - PubMed
    1. Nowak L, Bregestovski P, Ascher P, Herbet A, Prochiantz A. Nature. 1984;307:462–465. - PubMed
    1. van Zundert B, Yoshii A, Constantine-Paton M. Trends Neurosci. 2004;27:428–437. - PubMed
    1. Tovar KR, Westbrook GL. J Neurosci. 1999;19:4180–4188. - PMC - PubMed

Publication types

LinkOut - more resources