

Response variability of marmoset parvocellular neurons
- PMID: 17124265
- PMCID: PMC2075379
- DOI: 10.1113/jphysiol.2006.122283
Response variability of marmoset parvocellular neurons
Abstract
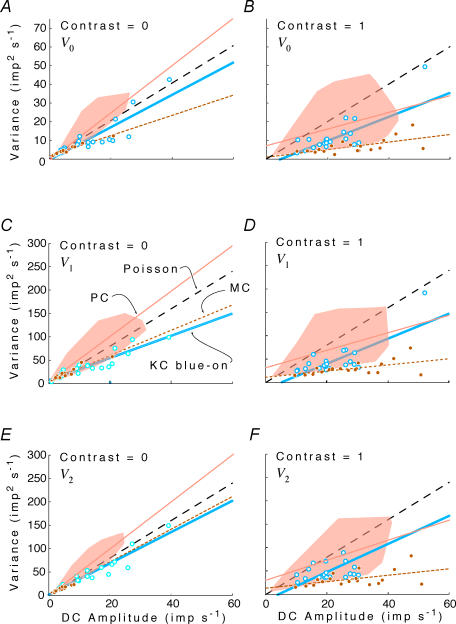
This study concerns the properties of neurons carrying signals for colour vision in primates. We investigated the variability of responses of individual parvocellular lateral geniculate neurons of dichromatic and trichromatic marmosets to drifting sinusoidal luminance and chromatic gratings. Response variability was quantified by the cycle-to-cycle variation in Fourier components of the response. Averaged across the population, the variability at low contrasts was greater than predicted by a Poisson process, and at high contrasts the responses were approximately 40% more variable than responses at low contrasts. The contrast-dependent increase in variability was nevertheless below that expected from the increase in firing rate. Variability falls below the Poisson prediction at high contrast, and intrinsic variability of the spike train decreases as contrast increases. Thus, while deeply modulated responses in parvocellular cells have a larger absolute variability than weakly modulated ones, they have a more favourable signal: noise ratio than predicted by a Poisson process. Similar results were obtained from a small sample of magnocellular and koniocellular ('blue-on') neurons. For parvocellular neurons with pronounced colour opponency, chromatic responses were, on average, less variable (10-15%, p<0.01) than luminance responses of equal magnitude. Conversely, non-opponent parvocellular neurons showed the opposite tendency. This is consistent with a supra-additive noise source prior to combination of cone signals. In summary, though variability of parvocellular neurons is largely independent of the way in which they combine cone signals, the noise characteristics of retinal circuitry may augment specialization of parvocellular neurons to signal luminance or chromatic contrast.
Figures
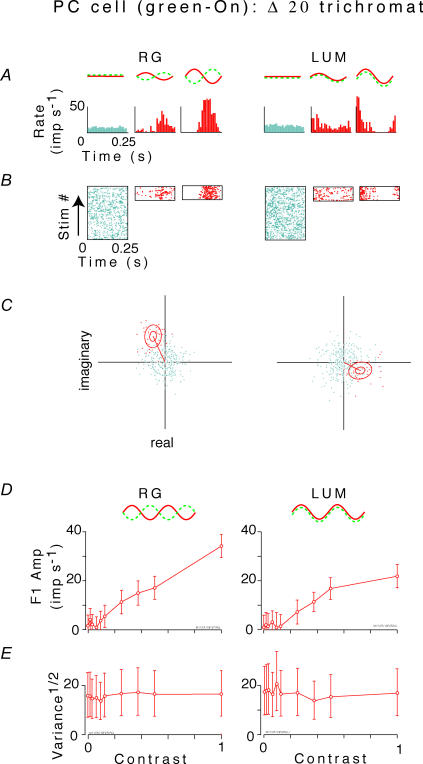
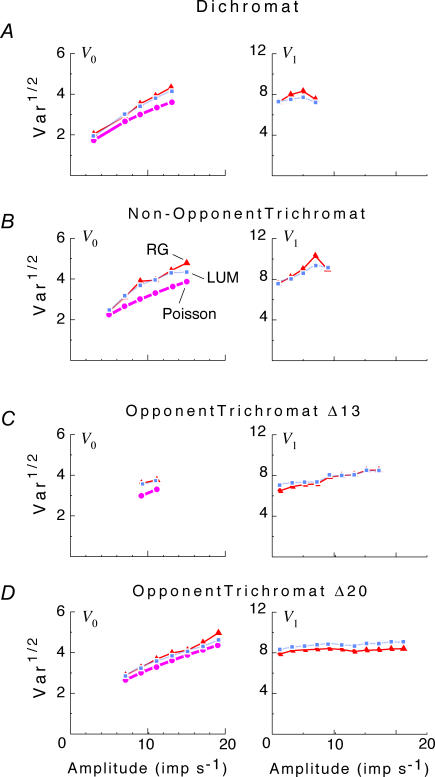
 , at each contrast C. Error bars represent 95% confidence limits, as calculated by an F statistic (see Appendix I).
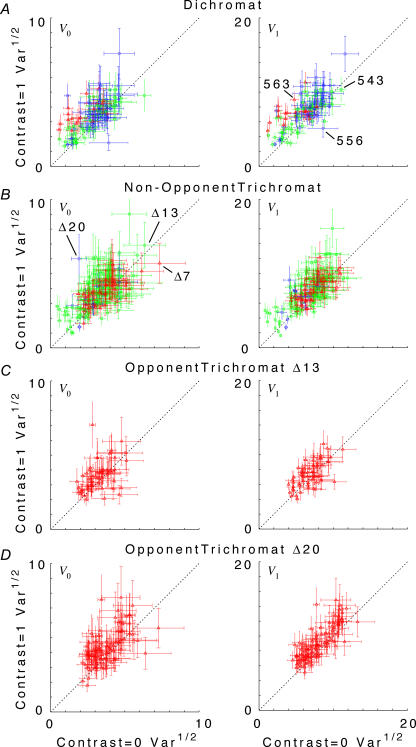
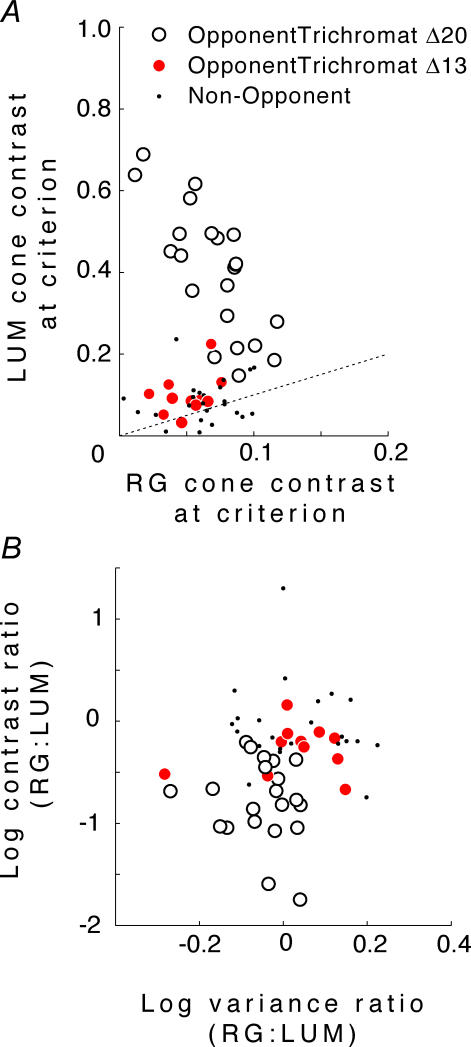
 at the same criterion response amplitude as shown in Fig. 4 for RG and LUM conditions. The straight line corresponds to cavg(RG) =cavg(LUM). B, relationship of variance ratio
  to cone contrast ratio
  . Opponent neurons in Δ20 animals have a lower value of
  than opponent neurons in Δ13 animals, even at the same cone contrast ratio. Note that Contrast = 1 for a chromatic stimulus has a much lower cone contrast than a Contrast = 1 luminance stimulus, depending on phenotype (Table 1).
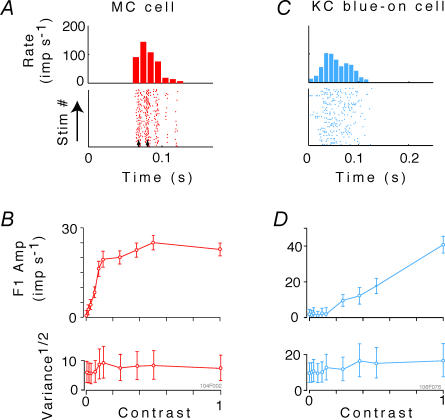
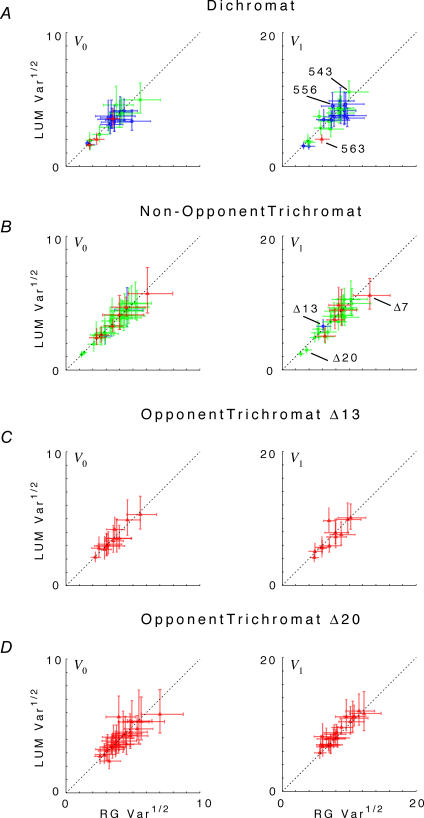
 , at each contrast C. Error bars represent 95% confidence limits, as calculated by an F statistic (see Appendix 1).
References
-
- Anderson T. An Introduction to Multivariate Statistical Analysis. New York: Wiley; 1958.
-
- Atick JJ, Redlich AN. Towards a theory of early visual processing. Neural Comput. 1990;2:308–320.
-
- Barlow HB. Critical limiting factors in the design of the eye and visual cortex. Proc R Soc Lond B Biol Sci. 1981;212:1–34. - PubMed
Publication types
MeSH terms
Grants and funding
LinkOut - more resources
Full Text Sources