. 2007 Feb 1;578(Pt 3):735-50.
doi: 10.1113/jphysiol.2006.121871. Epub 2006 Nov 23.

Neurotransmitter mechanisms mediating low-glucose signalling in cocultures and fresh tissue slices of rat carotid body

Affiliations

Neurotransmitter mechanisms mediating low-glucose signalling in cocultures and fresh tissue slices of rat carotid body

Min Zhang et al. J Physiol. .

Abstract

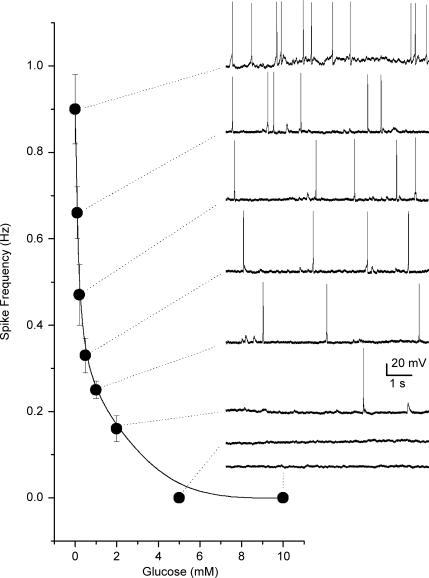
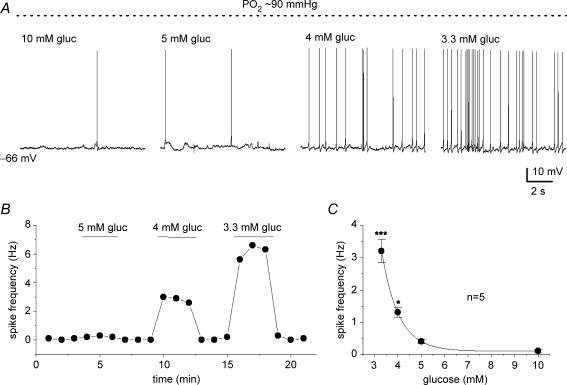
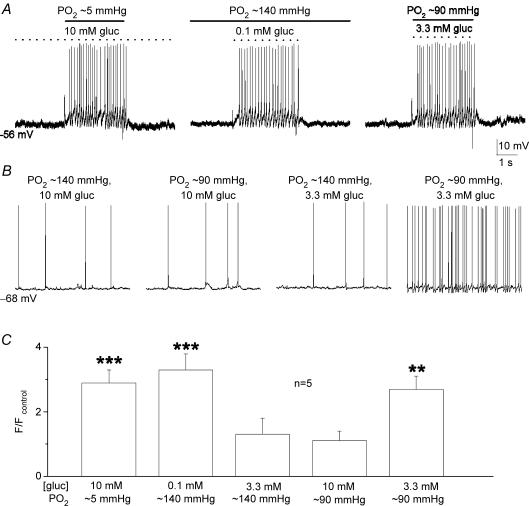
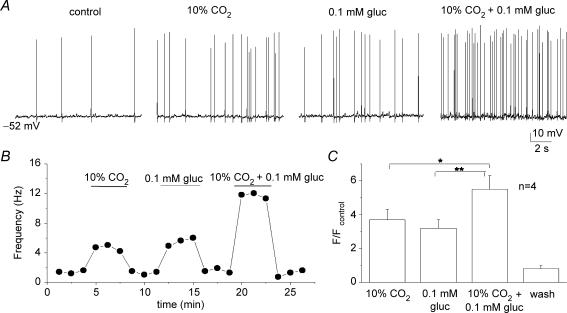
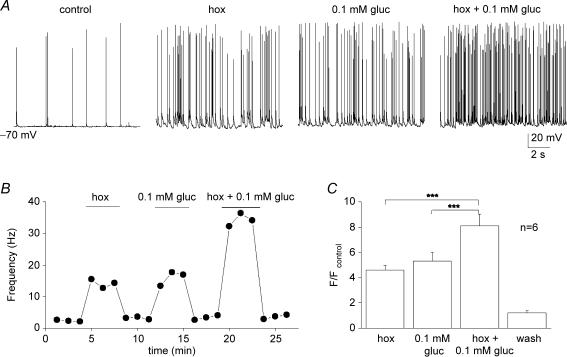
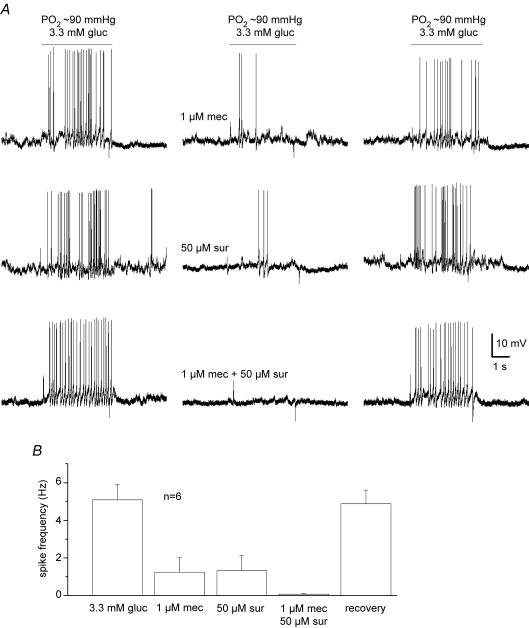
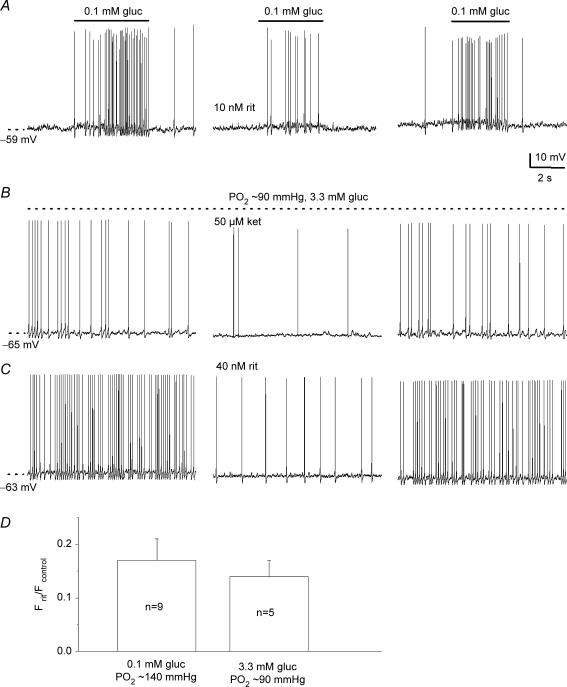
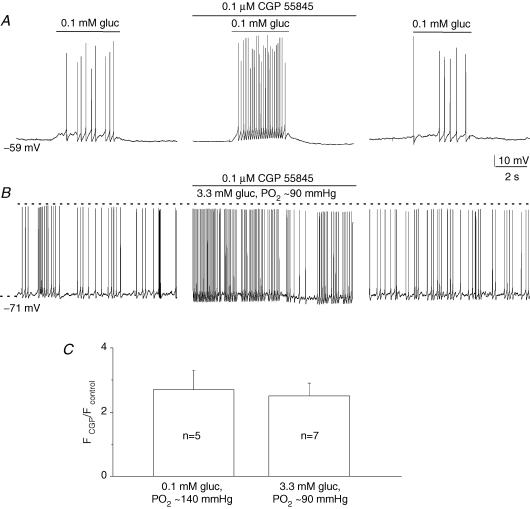
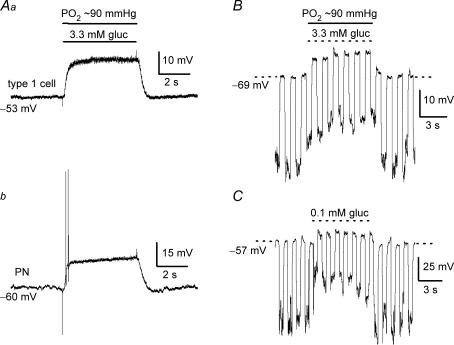
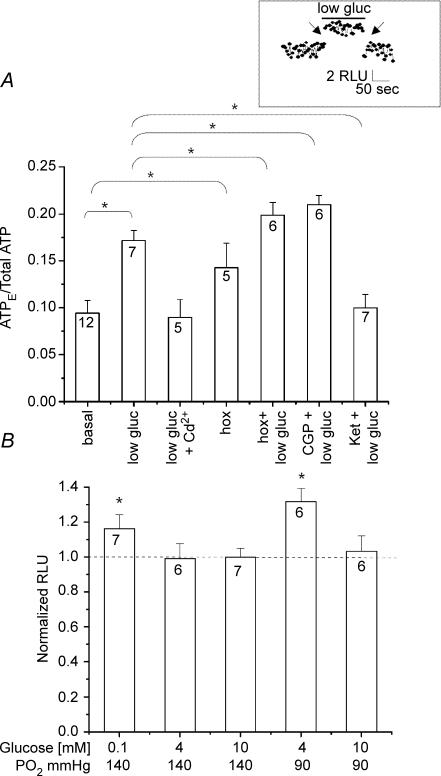
The mammalian carotid body (CB) is a polymodal chemosensor which can detect low blood glucose (hypoglycaemia), leading to increased afferent discharge and activation of counter-regulatory autonomic pathways. The underlying neurotransmitter mechanisms are unknown and controversy surrounds whether the action of low glucose is direct or indirect. To address this, we used a coculture model containing functional chemosensory units of rat CB receptor (type I) cell clusters and afferent petrosal neurones (PN). During perforated-patch, whole-cell recordings, low glucose (0-2 mM) stimulated sensory discharge in cocultured PN. When the background P(O2) was lowered to levels typical of arterial blood (approximately 90 mmHg), robust PN chemoexcitation could be induced by physiological hypoglycaemia (3.3-4 mM glucose). These sensory responses were reversibly inhibited by a combination of purinergic (suramin, 50 microM) and nicotinic (mecamylamine, 1 microM) receptor blockers, suggesting that transmission depended on corelease of ATP and ACh. Hypoglycaemic responses were additive with those evoked by hypoxia or hypercapnia; further, they could be potentiated by the GABAB receptor blocker (CGP 55845) and inhibited by 5-HT2A receptor blockers (ketanserin or ritanserin). During paired simultaneous recordings from a PN and a type I cell in an adjacent cluster, the afferent PN response coincided with type I cell depolarization, which was associated with a decrease in input resistance. In fresh tissue slices of rat CB, low glucose stimulated ATP secretion as determined by the luciferin-luciferase assay; this secretion was cadmium sensitive, potentiated by CGP 55845, and inhibited by ketanserin. Taken together these data indicate that CB receptors act as direct glucosensors, and that processing of hypoglycaemia utilizes similar neurotransmitter and neuromodulatory mechanisms as hypoxia.


Figures

Figure 1
Figure 1
Dose–response curve showing relation between glucose concentration and sensory discharge from a cocultured petrosal neurone This neurone formed a functional chemosensory unit with an adjacent type I cell cluster as indicated by an increase in spike discharge during hypoxia (not shown). Spike discharge also increased in a dose-dependent manner following a decrease in glucose concentration as illustrated in the diagram. Data points represent mean (± s.e.m.) spike frequency estimated from 3 to 4 10 s recording segments at each glucose concentration. Sample traces of spike discharge are illustrated on the right for the corresponding glucose concentration; resting potential was ∼–58 mV. Recordings were obtained in bicarbonate/5% CO2-buffered medium at normoxic PO2 (140 mmHg).
Figure 3
Figure 3
Physiological hypoglycaemia causes a dose-dependent increase in sensory discharge in cocultured petrosal neurones When background PO2 was adjusted to near-arterial levels (∼90 mmHg), lowering glucose concentration to 4 and 3.3 mm (i.e. within the physiological hypoglycaemic range) caused a progressive increase in spike frequency in the same neurone, as shown in sample traces (A) and the time series plot (B). Dose–response relation between PN spike frequency discharge versus glucose concentration at a background PO2 of ∼90 mmHg is shown for a group of 5 cocultured neurones in C; significant differences relative to 10 mm glucose are indicated by *P < 0.05 and ***P < 0.001.
Figure 2
Figure 2
Low-glucose induced chemoexcitatory responses in cocultured petrosal neurones under differentPO2backgrounds A, current clamp recordings were obtained from the same neurone (adjacent to a type I cell cluster) during perfusion of the culture with solutions containing standard glucose/hypoxia (10 mm gluc; ∼5 mmHg) on left, low glucose/normoxia (0.1 mm gluc; ∼140 mmHg) in the middle, and low glucose/‘arterial’PO2 (3.3 mm gluc; ∼90 mmHg) or ‘physiological hypoglycaemia’ on the right. Recordings from a different neurone in B show sample traces of spike discharge at different PO2 and glucose concentrations. Note that lowering glucose concentration to within the physiological hypoglycaemic range of 3.3 mm had little effect on sensory discharge at normoxic PO2 (140 mmHg), but produced robust chemoexcitation at an ‘arterial’PO2 of ∼90 mmHg (cf. two right traces). Also, lowering PO2 from 140 to 90 mmHg at standard (high) glucose levels had negligible effect on sensory discharge (cf. two left traces). C, summary of relative changes in spike frequency (F) induced by the different stimuli as indicated, for groups of cocultured neurones (n = 5); spike frequency ratio F/Fcontrol is plotted on the ordinate, where Fcontrol refers to spike frequency recorded in 10 mm glucose at normoxic (140 mmHg) PO2 (e.g. left trace in B); significant differences indicated by **P < 0.01 and ***P < 0.001.
Figure 5
Figure 5
Interaction between low glucose and isohydric hypercapnia on sensory discharge A, sample traces showing effects of isohydric hypercapnia (10% CO2; pH 7.4; 10 mm glucose), low glucose in normocapnia (5% CO2; pH 7.4; 0.1 mm glucose), and isohydric hypercapia plus low glucose, on chemosensory discharge recorded in a cocultured neurone. Corresponding time series plot of discharge frequency is shown for the same neurone in B. Note additive interaction between isohydric hypercapnia and low glucose in B, and for a group of 4 cocultured neurones in C. Data in C are plotted as spike frequency (F) ratio relative to control (Fcontrol), where Fcontrol is frequency recorded in 10 mm glucose/5% CO2(PO2 ≈ 140 mmHg); significant differences indicated by *P < 0.05 and **P < 0.01.
Figure 4
Figure 4
Interaction between low glucose and hypoxia on sensory discharge A, sample traces showing effects of hypoxia (hox; PO2 ≈ 5 mmHg), 0.1 glucose (PO2 ≈ 140 mmHg), and hypoxia plus 0.1 mm glucose, on chemosensory discharge recorded in a cocultured neurone. Corresponding time series plot of discharge frequency is shown for the same neurone in B. Note additive interaction between hypoxia and low glucose in B, and for a group of 6 similar cocultured neurones in C. Data in C are plotted as spike frequency (F) ratio relative to control (Fcontrol), where Fcontrol is frequency recorded in 10 mm glucose/PO2 ≈ 140 mmHg; significant differences indicated by ***P < 0.001.
Figure 6
Figure 6
Effects of nicotinic and purinergic receptor blockers on sensory discharge evoked by physiological hypoglycaemia in cocultures A, sample traces showing partial inhibition of sensory discharge induced by 3.3 mm glucose (PO2 ≈ 90 mmHg) in a cocultured petrosal neurone during exposure to the nicotinic blocker, mecamylamine (1 μm mec; upper traces) and the purinergic blocker, suramin (50 μm sur; middle traces). Note complete inhibition of sensory discharge by combined application of mecamylamine and suramin. Mean (± s.e.m.) spike frequency data for a group of 6 similar cocultured neurones before, during, and after application of the indicated receptor blockers are summarized in B.
Figure 7
Figure 7
Blockers of 5-HT2a receptors inhibit sensory discharge induced by low glucose in cocultured neurones A, sample traces showing reversible inhibition of low glucose-induced (0.1 mm gluc/PO2 ≈ 140 mmHg) sensory discharge by 10 nm ritanserin. Similar results were obtained during application of ‘physiological hypoglycaemia’ (3.3 mm gluc/PO2 ≈ 90 mmHg) in the presence of 50 μm ketanserin (ket; B) and 40 nm ritanserin (rit; C). Effects of ritanserin on low glucose-induced spike frequency (F) discharge are plotted as a ratio Frit/Fcontrol for groups of cocultured petrosal neurones as indicated in the bar graph (D); Fcontrol and Frit refer to the spike frequency before and during ritanserin, respectively. Note ratio is < 1, due to inhibition of the discharge by ritanserin.
Figure 8
Figure 8
Blockers of GABAB receptors potentiate sensory discharge induced by low glucose in cocultured neurones A, sample traces showing reversible potentiation of low glucose-induced (0.1 mm gluc/PO2 ≈ 140 mmHg) sensory discharge by 0.1 μm CGP 55845, a GABAB receptor blocker. A similar potentiation was obtained during application of ‘physiological hypoglycaemia’ (3.3 mm gluc/PO2 ≈ 90 mmHg) as exemplified in B. Effects of CGP 55845 on low glucose-induced spike frequency (F) discharge are plotted as a ratio FCGP/Fcontrol for groups of cocultured petrosal neurones as indicated in the bar graph (C); Fcontrol and FCGP refer to the spike frequency before and during CGP 55845, respectively. Note ratio is > 1, due to potentiation of the discharge by CGP 55845.
Figure 9
Figure 9
Low glucose-induced receptor potential in type I cells and simultaneous recordings of presynaptic and postsynaptic chemoexcitatory responses in coculture Presynaptic depolarization or ‘receptor potential’ in a type I cell (Aa) and postsynaptic depolarization (and brief spike activity) in juxtaposed petrosal neurone (Ab) are shown during simultaneous paired recordings, before, during (horizontal bars) and after exposure of the coculture to physiological hypoglycaemia (3.3 mm glucose/PO2 ≈ 90 mmHg). The receptor potential was associated with a decrease in input resistance, as indicated by injecting constant hyperpolarizing current pulses (downward deflections), during application of 3.3 mm glucose (PO2 ≈ 90 mmHg) to a clustered type I cell (B) or 0.1 mm glucose (PO2 ≈ 140 mmHg) to a single type I cell ∼24 h after isolation (c).
Figure 10
Figure 10
Hypoglycaemia-evoked ATP release from fresh carotid body (CB) slices A, ATP release from CB slices, during exposure to a background PO2 of 85–90 mmHg, was monitored using the luciferin–luciferase assay and expressed as a ratio of extracellular ATP (ATPE) versus total ATP content. Note low glucose (4 mm) stimulated ATP release that was inhibited by the general Ca2+ channel blocker cadmium (Cd2+; 50 μm). Also, hypoxia (PO2 ≈ 15 mmHg) stimulated ATP release, and its effect was additive with that of low glucose. Application of the GABAB receptor antagonist CGP 55845 (CGP; 0.1 μm) enhanced hypoglycaemia-evoked ATP release, whereas the 5-HT receptor antagonist ketanserin (ket; 50 μm) inhibited this response. Neither CGP 55845 nor ketanserin caused significant changes in ATPE when added alone (not shown). Connecting lines indicate statistically significant differences using the Mann–Whitney one-tailed test (*P < 0.05). Sample size ‘n’ is indicated in each bar. Inset shows sample trace of real time recording before, during and after application of low glucose; a 1 min break (arrow) occurred when solutions were changed. B, normalized ATP secretion from CB slices at different PO2 and various glucose concentrations as indicated (bottom). The chemiluminescence signal (relative light units or RLU) due to low glucose-induced ATP release was normalized to basal ATP levels and expressed as a ratio on the ordinate. Hypoglycaemia under normoxic conditions (0.1 mm, PO2 ≈ 140 mmHg) caused a significant increase in extracellular ATP. A robust response was also observed when CB slices were exposed to physiological hypoglycaemia at PO2 near that of arterial blood (4 mm glucose/PO2 ≈ 90 mmHg). Note that exposure of CB slices to 4 mm glucose under normoxia (PO2 ≈ 140 mmHg) did not stimulate ATP release. Sample size ‘n’ is indicated in each bar. Statistical analysis was performed using the Mann–Whitney test. *Indicates significantly (P < 0.05) different from control.

Comment in

Similar articles

Cited by

References

    1. Alvarez-Buylla R, de Alvarez-Buylla ER. Carotid sinus receptors participate in glucose homeostasis. Respir Physiol. 1988;72:347–360. - PubMed
    1. Bin-Jaliah I, Maskell PD, Kumar P. Indirect sensing of insulin-induced hypoglycaemia by the carotid body in the rat. J Physiol. 2004;556:255–266. - PMC - PubMed
    1. Bin-Jaliah I, Maskell PD, Kumar P. Carbon dioxide sensitivity during hypoglycaemia-induced, elevated metabolism in the anaesthetized rat. J Physiol. 2005;563:883–893. - PMC - PubMed
    1. Buckler KJ. A novel oxygen-sensitive potassium current in rat carotid body type 1 cells. J Physiol. 1997;498:649–662. - PMC - PubMed
    1. Buniel MC, Schilling WP, Kunze DL. Distribution of transient receptor potential channels in the rat carotid chemosensory pathway. J Comp Neurol. 2003;464:404–413. - PubMed

Publication types