

An approach to joint analysis of longitudinal measurements and competing risks failure time data
- PMID: 17124698
- PMCID: PMC2586033
- DOI: 10.1002/sim.2749
An approach to joint analysis of longitudinal measurements and competing risks failure time data
Abstract
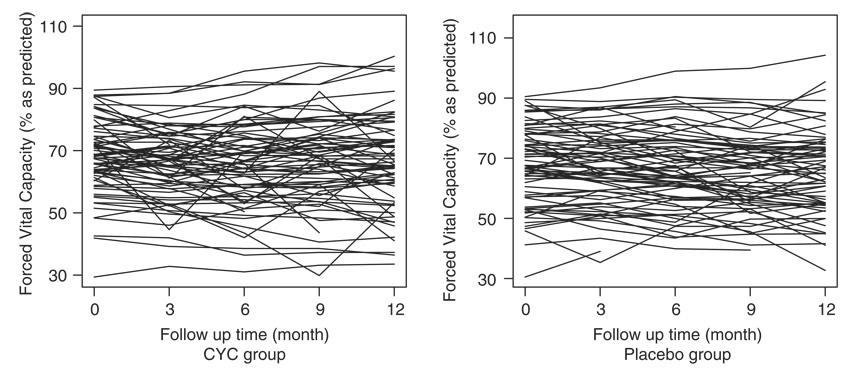
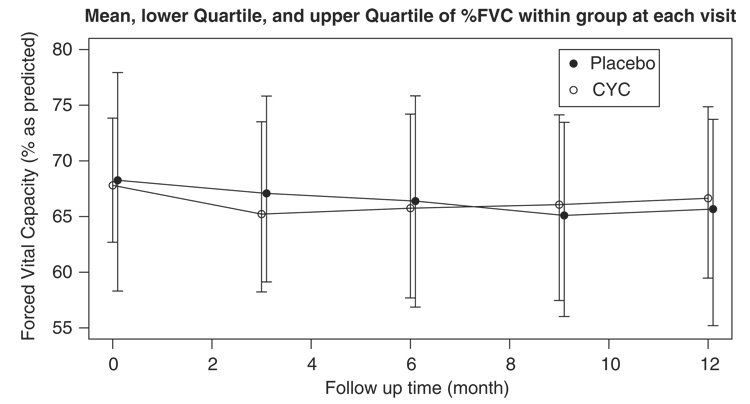
Joint analysis of longitudinal measurements and survival data has received much attention in recent years. However, previous work has primarily focused on a single failure type for the event time. In this paper we consider joint modelling of repeated measurements and competing risks failure time data to allow for more than one distinct failure type in the survival endpoint which occurs frequently in clinical trials. Our model uses latent random variables and common covariates to link together the sub-models for the longitudinal measurements and competing risks failure time data, respectively. An EM-based algorithm is derived to obtain the parameter estimates, and a profile likelihood method is proposed to estimate their standard errors. Our method enables one to make joint inference on multiple outcomes which is often necessary in analyses of clinical trials. Furthermore, joint analysis has several advantages compared with separate analysis of either the longitudinal data or competing risks survival data. By modelling the event time, the analysis of longitudinal measurements is adjusted to allow for non-ignorable missing data due to informative dropout, which cannot be appropriately handled by the standard linear mixed effects models alone. In addition, the joint model utilizes information from both outcomes, and could be substantially more efficient than the separate analysis of the competing risk survival data as shown in our simulation study. The performance of our method is evaluated and compared with separate analyses using both simulated data and a clinical trial for the scleroderma lung disease.
Copyright (c) 2006 John Wiley & Sons, Ltd.
Figures
References
-
- Tashkin DP, et al. Cyclophosphamide versus placebo in scleroderma lung disease. The New England Journal of Medicine. 2006;354:2655–2666. - PubMed
-
- Cox DR. Regression models and life tables. Journal of the Royal Statistical Society, Series B. 1972;34:187–200.
-
- Harville DA. Maximum likelihood approaches to variance component estimation and to related problems. Journal of the American Statistical Association. 1977;72:320–338.
-
- Laird NM, Ware JH. Random-effects models for longitudinal data. Biometrics. 1982;38:963–974. - PubMed
-
- Liang KY, Zeger SL. Longitudinal data analysis using generalized linear models. Biometrika. 1986;73:13–22.
MeSH terms
Grants and funding
LinkOut - more resources
Full Text Sources
Medical