Comparative Study
. 2006;5(7):22.
doi: 10.1186/jbiol50.

CNS progenitor cells and oligodendrocytes are targets of chemotherapeutic agents in vitro and in vivo

Affiliations
Comparative Study

CNS progenitor cells and oligodendrocytes are targets of chemotherapeutic agents in vitro and in vivo

Joerg Dietrich et al. J Biol. 2006.

Abstract

Background: Chemotherapy in cancer patients can be associated with serious short- and long-term adverse neurological effects, such as leukoencephalopathy and cognitive impairment, even when therapy is delivered systemically. The underlying cellular basis for these adverse effects is poorly understood.

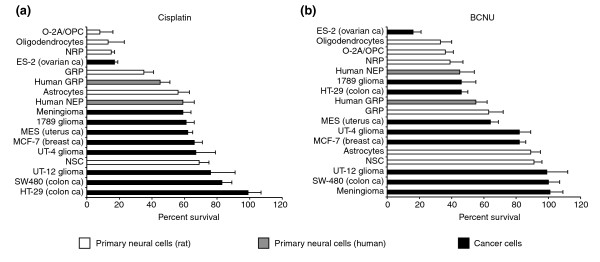
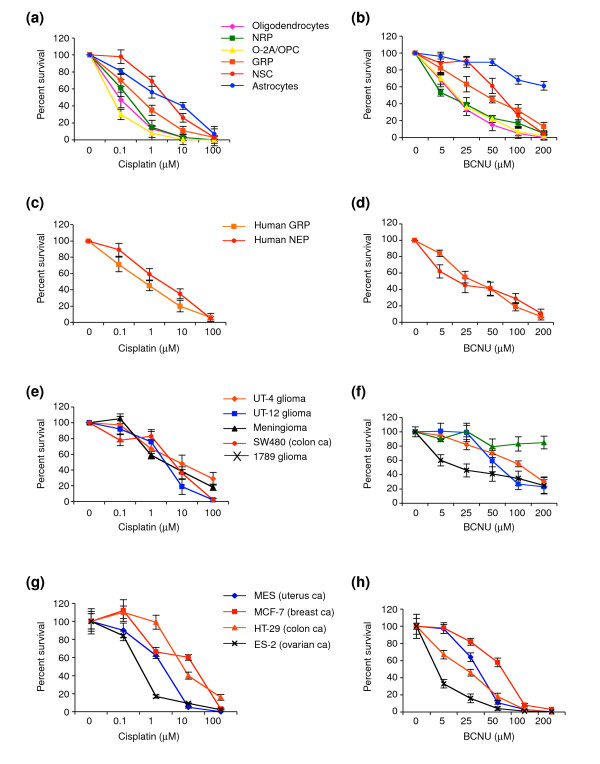
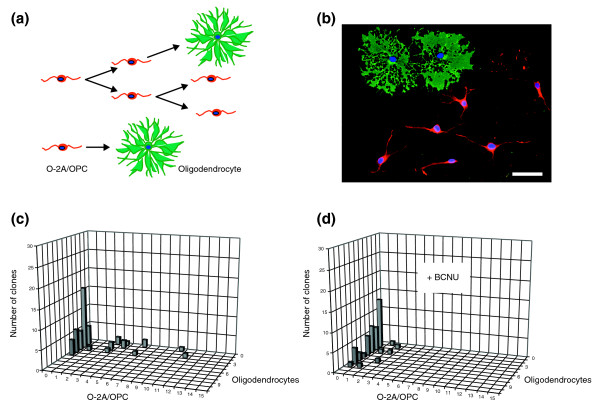
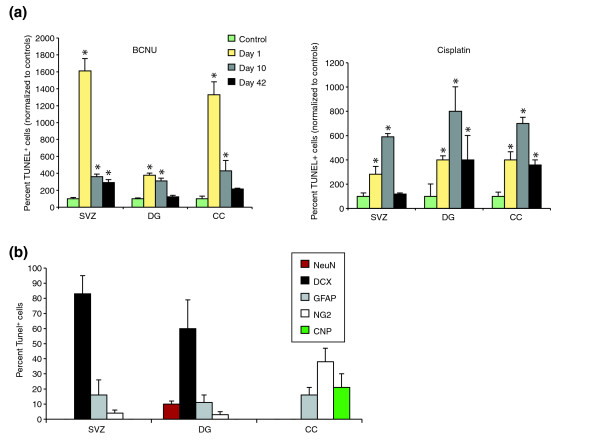
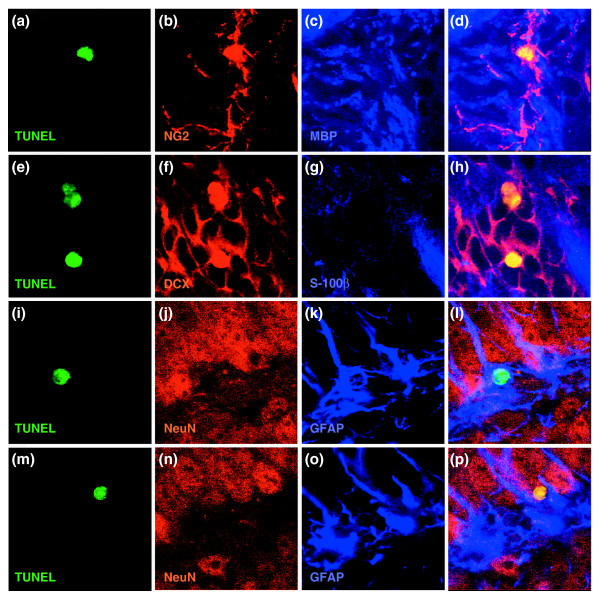
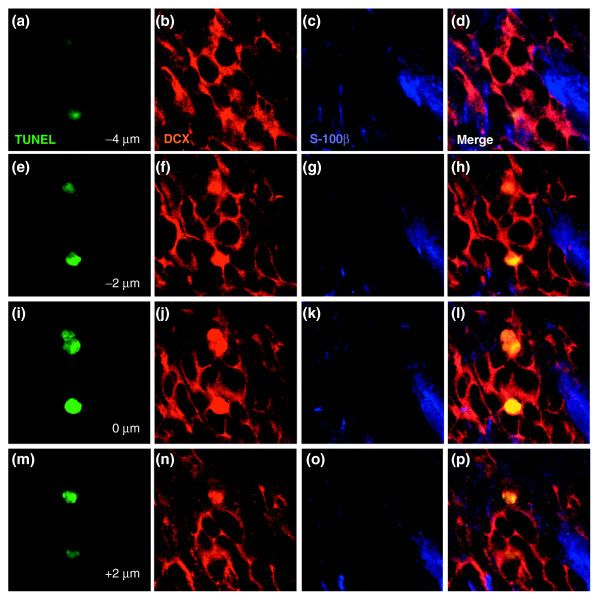
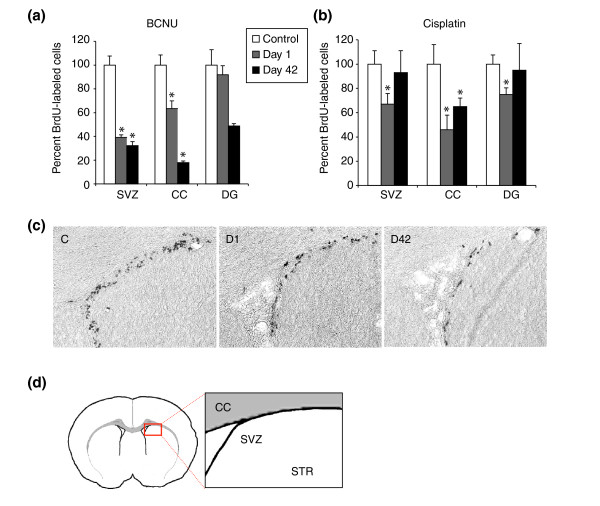
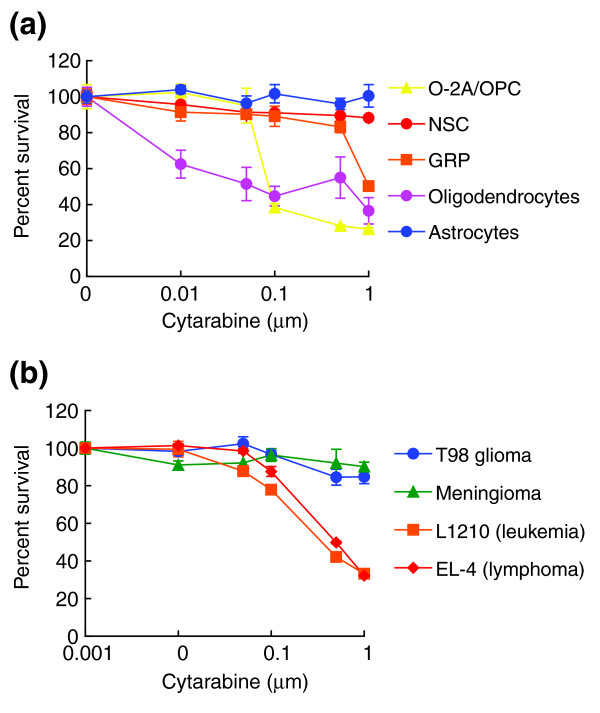
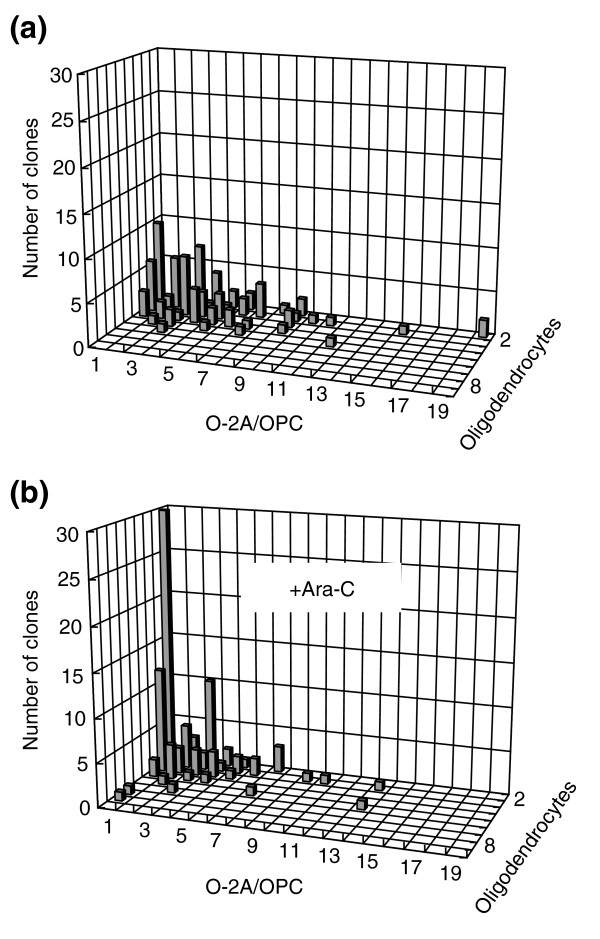
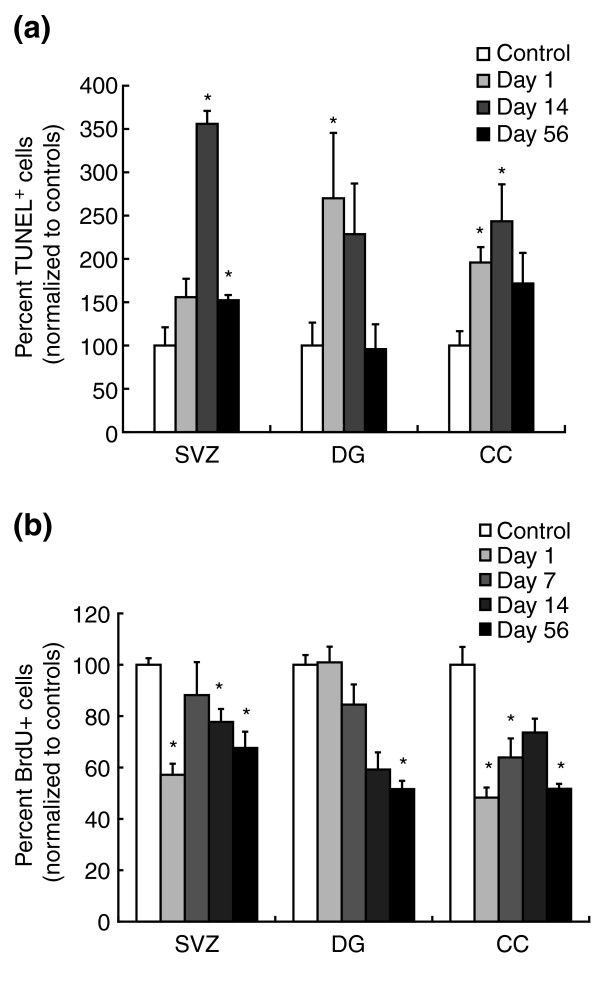
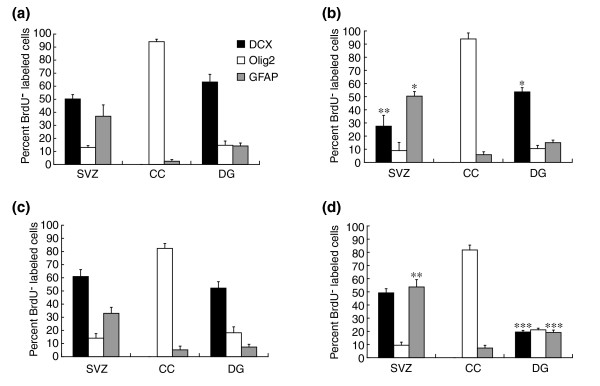
Results: We found that three mainstream chemotherapeutic agents--carmustine (BCNU), cisplatin, and cytosine arabinoside (cytarabine), representing two DNA cross-linking agents and an antimetabolite, respectively--applied at clinically relevant exposure levels to cultured cells are more toxic for the progenitor cells of the CNS and for nondividing oligodendrocytes than they are for multiple cancer cell lines. Enhancement of cell death and suppression of cell division were seen in vitro and in vivo. When administered systemically in mice, these chemotherapeutic agents were associated with increased cell death and decreased cell division in the subventricular zone, in the dentate gyrus of the hippocampus and in the corpus callosum of the CNS. In some cases, cell division was reduced, and cell death increased, for weeks after drug administration ended.

Conclusion: Identifying neural populations at risk during any cancer treatment is of great importance in developing means of reducing neurotoxicity and preserving quality of life in long-term survivors. Thus, as well as providing possible explanations for the adverse neurological effects of systemic chemotherapy, the strong correlations between our in vitro and in vivo analyses indicate that the same approaches we used to identify the reported toxicities can also provide rapid in vitro screens for analyzing new therapies and discovering means of achieving selective protection or targeted killing.


Figures

Figure 1
Figure 1
Schematic representation of the lineage relationships of the cell types examined in these studies. Pluripotent neuroepithelial stem cells (NSC) give rise to glial-restricted precursor (GRP) cells and neuron-restricted precursor (NRP) cells. NRP cells can give rise to multiple populations of neurons, whereas GRP cells give rise to astrocytes and oligodendrocyte-type-2 astrocytes (O-2A/OPCs). The O-2A/OPCs in turn give rise to oligodendrocytes. The progenitor cells that lie between NSCs and differentiated cell types, and are the major dividing cell population in the CNS, appear to be exceptionally vulnerable to the effects of chemotherapeutic agents. Also sharing this vulnerability are nondividing oligodendrocytes.
Figure 2
Figure 2
Primary CNS cells are more vulnerable to BCNU and cisplatin than are cancer cells. Cells were plated on coverslips in 24-well plates at a density of 1,000 cells per well and allowed to grow for 24–48 h. On the basis of drug concentrations achieved in human patients, cells were exposed to (a) cisplatin (1 μM; for 20 h) or (b) BCNU (25 μM; for 1 h). Cell survival and viability was determined after additional 24–48 h (see Materials and methods). The rat neural cell types studied included O-2A/OPCs, oligodendrocytes, NRP cells, GRP cells, NSCs, and astrocytes. The normal human neural cell types consisted of human GRP and neuroepithelial precursor cells (human NEP). The tumor cells studied were the human malignant glioma cells UT-4, UT-12, and 1789, the colon cancer cell lines HT-29 and SW480, a meningioma cell line (Men-1), breast cancer cells (MCF-7), uterine cancer cells (MES), and ovarian cancer cells (ES-2). Each experiment was carried out in quadruplicate and repeated multiple times in independent experiments. Data represents mean of survival ± SEM, normalized to control values.
Figure 3
Figure 3
Sensitivity of rat and human-derived CNS cells and human cancer cells to BCNU or cisplatin. Cells were treated with (a,c,e,g) cisplatin and (b,d,f,h) BCNU over a wide dose range (0.1–100 μM and 5–200 μM, respectively). Each experiment was carried out in quadruplicate and repeated multiple times in independent experiments. Data represents mean of survival ± SEM, normalized to control values. There are no concentrations of either drug for which tumor cell lines were more sensitive than the more sensitive neural progenitor cells and oligodendrocytes.
Figure 4
Figure 4
A low dose of BCNU decreases division and promotes differentiation of O-2A/OPCs. Cells grown at clonal density were exposed 1 day after plating to low-dose BCNU (2.5 μM for 1 h), a dosage that did not cause significant killing (< 5%) of O-2A/OPCs in mass culture. The number of undifferentiated O-2A/OPCs and differentiated cells (oligodendrocytes) was determined in each individual clone from a total number of 50 clones in each condition by morphological examination and by immunostaining with A2B5 and anti-GalC (galactocerebroside) antibodies (to label O-2A/OPCs and oligodendrocytes, respectively). (a) Schematic diagram of the differentiation potential of O-2A/OPCs. Bipolar O-2A/OPCs can undergo continued cell division(s) to form new precursor cells (red), and can differentiate into multipolar postmitotic oligodendrocytes (green). Alternatively, an O-2A/OPC can differentiate directly into an oligodendrocyte without further cell divisions. (b) An example of one clone in culture. Immunostaining with A2B5 (red) and anti-GalC (green) identifies six O-2A/OPCs and two oligodendrocytes. Cell nuclei stained in blue (DAPI). Scale bar represents 20 μm. (c) Composition of progenitors and oligodendrocytes in a representative experiment of control cultures analyzed 8 days after plating optic nerve-derived O-2A/OPCs at clonal density. Multiple clones with three or more O-2A/OPCs were seen. (d) In parallel BCNU-treated cultures, analyzed 8 days after plating at clonal density (7 days after BCNU exposure), no clones contained more than two O-2A/OPCs. Experiments were performed in triplicate in at least two independent experiments. In the experiments represented in (c) and (d) the proliferation and differentiation of O-2A/OPCs were followed over a time course of up to 10 days after BCNU treatment. Results are presented as representative three-dimensional graphs. The number of progenitors per clone is shown on the x (horizontal) axis, the number of oligodendrocytes on the z (orthogonal) axis and the number of clones with any particular composition on the y (vertical) axis.
Figure 5
Figure 5
Systemic chemotherapy leads to increased and prolonged cell death in the adult mouse CNS. Cell death was determined using the terminal deoxynucleotidyltransferase-mediated dUTP nick-end labeling (TUNEL) assay. The number of TUNEL+ cells was analyzed in control animals (which received 0.9% NaCl i.p.) and chemotherapy-treated animals and presented as percent normalized values of controls. Each treatment group consisted of n = 5 animals, including control groups at each time point. (a) Animals that received three BCNU (left panel) or cisplatin (right panel) injections (10 mg/kg or 5 mg/kg, respectively, on days 1, 3, and 5) show marked and prolonged increases in cell death in the lateral subventricular zone (SVZ), the corpus callosum (CC) and the dentate gyrus (DG) at 1, 10, and 42 days following treatment (n = 5 animals per group). *P < 0.01. (b) Co-analysis of TUNEL labeling with antigen expression reveals that the great majority of TUNEL+ cells in the SVZ and DG are doublecortin+ (DCX+) neuronal progenitors [44], and that other TUNEL+ cells include GFAP+ cells (which may be stem cells or astrocytes [45]) and NG2+ progenitor cells [46]. In the CC, in contrast, the TUNEL+ cells were NG2+ glial progenitor cells [47], CNPase+ (CNP+) oligodendrocytes or GFAP+ astrocytes. Co-labeling for TUNEL and myelin basic protein expression revealed results similar to CNPase analysis. Note that close to 100% of TUNEL+ cells are accounted for by known lineage markers.
Figure 6
Figure 6
Representative images of co-labeling for TUNEL and expression of cell type-specific antigens. Despite the apparent labeling of nuclei with cell-type specific antibodies in dying cells (presumably due to the changes in antigen distribution associated with nuclear fragmentation), co-labeling was highly cell-type specific (see also Figure 7 for z-stack analysis). (a-d) NG2+/TUNEL+ cells from the CC. In this and subsequent rows, the first image is of TUNEL staining, the next two images are of staining for the proteins indicated, and the merged image is on the far right. (e-h) DCX+/TUNEL+ cells from SVZ; (i-l) GFAP+/TUNEL+ cell from DG. (m-p) NeuN+/TUNEL+ cell from DG. In all merged images except (l) co-labeled cells show up as yellow; in (l) the nucleus of the co-labeled cell is green. Magnification 400×.
Figure 7
Figure 7
Representative z-stack of TUNEL+/doublecortin+ cells. Photographs were taken at 2 μm intervals. Identical analyses were conducted for every cell that was scored as TUNEL+ and expressing a cell type-specific antigen, as shown in Figure 4. Each row shows, from left to right, TUNEL staining, doublecortin staining, S-100b staining, and the merged image. (a-d) Images taken at -4 μm; (e-h) -2 μm; (i-l) 0 μm; (m-p) 2 μm. The congruence between the doublecortin+ staining and the TUNEL+ nuclei (which shows up as yellow in the merged image) was presumably due to the changes in antigen distribution associated with nuclear fragmentation, as this was always cell-type specific in that there was overlap only in those cases in which the rest of the cell was also stained with the same antibody. For example TUNEL+/doublecortin+ cells were always doublecortin+ in the cytoplasm, and other antibodies used in the same sections did not label the TUNEL-labeled nuclei of doublecortin+ cells.
Figure 8
Figure 8
Chemotherapy decreases cell proliferation in the adult mouse CNS. Systemic exposure to cisplatin and BCNU was associated with profound changes in the number of BrdU-incorporating cells in the lateral SVZ, the DG and the CC. Animals were treated as described in Figure 5. The graphs show the percent-corrected values of BrdU+ cells per brain area normalized to the number of BrdU+ cells in sham-treated animals at various time points after systemic treatment with either BCNU or cisplatin. Data are means ± SEM. (a,b) Percent-corrected values of BrdU+ cells after (a) BCNU treatment or (b) cisplatin treatment. Bars labeled with an asterisk show statistically significant (P < 0.01) differences from control animals. (c) Immunoperoxidase staining for detection of BrdU+ cells in the lateral SVZ in representative sections from a 0.9% NaCl-injected control animal (C), one day (D1), and 42 days (D42) after systemic treatment with BCNU (3 × 10 mg/kg i.p.). (d) Diagrammatic representation of the part of the SVZ shown in (c) with adjacent part of the striatum (STR) and the overlying CC.
Figure 9
Figure 9
Primary CNS cells are equally or more vulnerable to cytarabine than cancer cells. Cells were plated on coverslips in 24-well plates at a density of 1,000 cells per well and allowed to grow for 24–48 h. On the basis of drug concentrations achieved in human patients, cells were exposed to cytarabine for 24 h. Cell survival and viability was determined after additional 24–48 h (see Materials and methods). (a) Rat neural cell types studied included O-2A/OPCs, oligodendrocytes, GRP cells, NSCs and astrocytes. (b) We also examined the T98 glioma cell line, a meningioma cell line, and the L1210 and EL-4 leukemia cell lines. To define the onset of cytarabine toxicity, cells were treated with cytarabine over a wide dose range (0.01–1 μM) extending downwards from the lower ranges achieved in high-dose therapy. Each experiment was carried out in quadruplicate and was repeated multiple times in independent experiments. Data represent mean of survival ± SEM, normalized to control values. There are no concentrations of cytarabine at which tumor cell lines were more sensitive O-2A/OPCs or oligodendrocytes.
Figure 10
Figure 10
Low-dose cytarabine decreases division and promotes differentiation of O-2A/OPCs. Cells grown at clonal density were exposed 1 day after plating to low-dose cytarabine (0.01 μM for 24 h), a dosage that killed less than 5% of O-2A/OPCs in mass culture (Figure 9). The number of undifferentiated O-2A/OPCs and differentiated cells (oligodendrocytes) was determined in each individual clone from a total of 100 clones in each condition by morphological examination and by immunostaining with A2B5 and anti-GalC antibodies (to label O-2A/OPCs and oligodendrocytes, respectively), as in Figure 4. (a) Composition of progenitors and oligodendrocytes in a representative experiment of control cultures analyzed 6 days after plating optic nerve-derived O-2A/OPCs cells at clonal density. (b) In parallel cytarabine (Ara-C)-treated cultures analyzed 6 days after plating at clonal density (5 days after the start of cytarabine exposure), there was a marked increase in the representation of small clones consisting wholly of oligodendrocytes, a reduction in the representation of large clones, and a general shift of clone size towards smaller values. Experiments were performed in triplicate in at least two independent experiments.
Figure 11
Figure 11
Systemic chemotherapy with cytarabine leads to increased and prolonged cell death, and decreased BrdU incorporation, in the adult mouse CNS. Cell death and BrdU incorporation were examined as in Figures 5 and 8. (a) The number of TUNEL+ cells was analyzed in control animals and is presented as percent normalized values of controls. Each treatment group consisted of n = 5 animals, including control groups at each time point. Animals that received three cytarabine injections (250 mg/kg on days 1, 3, and 5 leading up to the analysis, where day 1 of analysis equals one day after the last treatment with cytarabine) show marked increases in cell death in the SVZ, CC and DG at various time points after treatment (n = 5 animals per group). (b) BrdU analysis. Animals were treated as for (a). As in Figure 8, the graphs show the percent BrdU+ cells per brain area normalized to the number of BrdU+ cells in sham-treated animals at various time points after systemic treatment with cytarabine. Data are means ± SEM; *P < 0.01 in comparisons with control animals.
Figure 12
Figure 12
Co-analysis of BrdU incorporation with antigen expression indicates that division of both DCX+ neuronal progenitors and Olig2+ oligodendrocyte precursors is reduced by systemic exposure to cytarabine. In the CC, where there was an approximately 50% reduction in the number of BrdU+ cells (see Figure 11b), the proportion of BrdU+ cells that were Olig2+ was no different between controls and treated animals on either day 1 ((a) control; (b) cytarabine) or on day 56 ((c) control; (d) cytarabine) after completion of treatment. Thus, the reduction in apparent division of Olig2+ cells was proportionate to the overall reduction in all BrdU+ cells. In contrast with effects on Olig2+ populations in the corpus callosum, our analyses indicate an enhanced loss of DCX+ cells from among the BrdU+ population in both the SVZ and DG. This was particularly striking in the DG, where at 56 days post-treatment the proportion of BrdU+ cells in the cytarabine-treated animals was < 40% of that seen in control animals. Data are means ± SEM; *P < 0.05, **P < 0.01, and ***P < 0.001 in comparisons with control animals.
Figure 13
Figure 13
Slice (three-sided) reconstruction of a BrdU+/DCX+ cell. Photographs were taken at 2 μm intervals. Identical analyses were conducted for every cell that was scored as BrdU+ and expressing a cell-type specific antigen, as shown in Figure 4. The three-sided reconstruction shows that the BrdU+ nucleus (green) belongs to the DCX+ cell (red).
Figure 14
Figure 14
Representative z-stack of a BrdU+/Olig2+ cell. Photographs were taken as for Figure 13. Identical analyses were conducted for every cell that was scored as BrdU+ and expressing a cell-type specific antigen, as shown in Figure 4. As seen, the BrdU+ nucleus (green) was that of the Olig2+ cell (blue) indicated by a white arrow. Each row shows, from left to right, BrdU incorporation, staining for Oligo2, and the merged image. Images taken at (a-c) -4 μm; (d-f) -2 μm; (g-i) 0 μm; (j-l) 2 μm; (m-o) 4 μm.

References

    1. Brown MS, Stemmer SM, Simon JH, Stears JC, Jones RB, Cagnoni PJ, Sheeder JL. White matter disease induced by high-dose chemotherapy: longitudinal study with MR imaging and proton spectroscopy. Am J Neuroradiol. 1998;19:217–221. - PMC - PubMed
    1. Stemmer SM, Stears JC, Burton BS, Jones RB, Simon JH. White matter changes in patients with breast cancer treated with high-dose chemotherapy and autologous bone marrow support. Am J Neuroradiol. 1994;15:1267–1273. - PMC - PubMed
    1. Cheson BD, Vena DA, Foss FM, Sorensen JM. Neurotoxicity of purine analogs: a review. J Clin Oncol. 1994;12:2216–2228. - PubMed
    1. Appleton RE, Farrell K, Zaide J, Rogers P. Decline in head growth and cognitive impairment in survivors of acute lymphoblastic leukaemia. Arch Dis Child. 1990;65:530–534. - PMC - PubMed
    1. Brezden CB, Phillips KA, Abdolell M, Bunston T, Tannock IF. Cognitive function in breast cancer patients receiving adjuvant chemotherapy. J Clin Oncol. 2000;18:2695–2701. - PubMed

Publication types

MeSH terms

Substances