

Recombinant protein production in an Escherichia coli reduced genome strain
- PMID: 17126054
- PMCID: PMC3710453
- DOI: 10.1016/j.ymben.2006.10.002
Recombinant protein production in an Escherichia coli reduced genome strain
Abstract
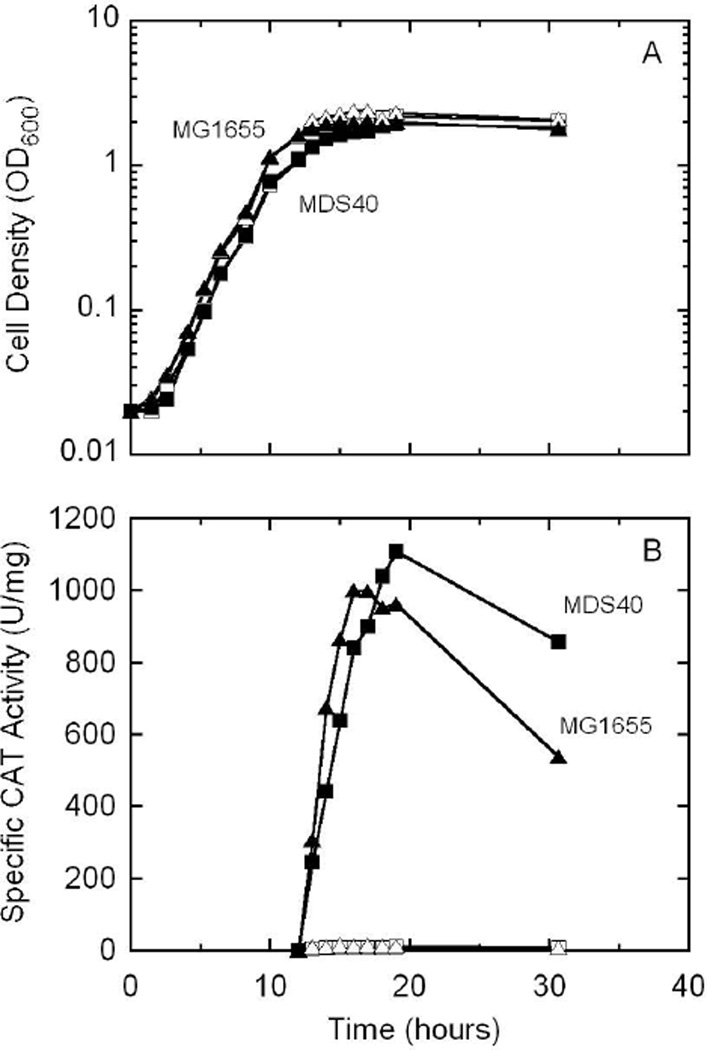
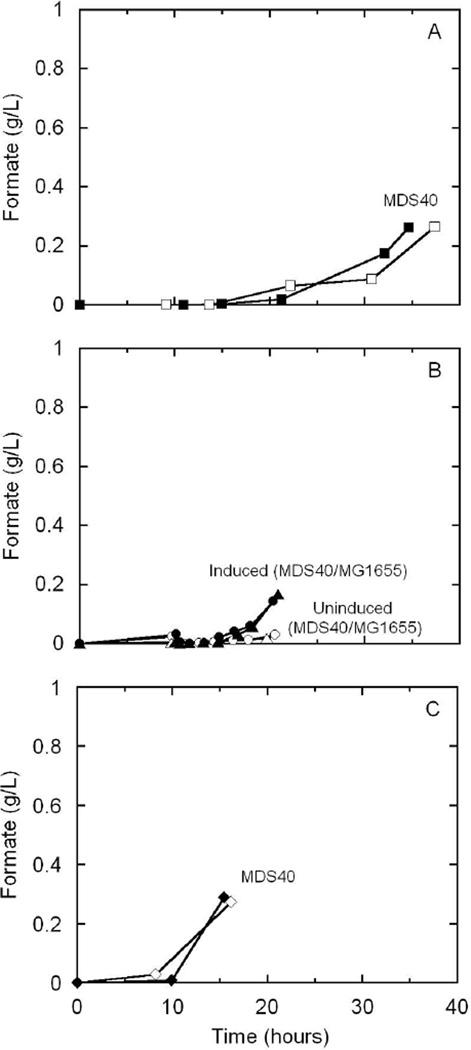
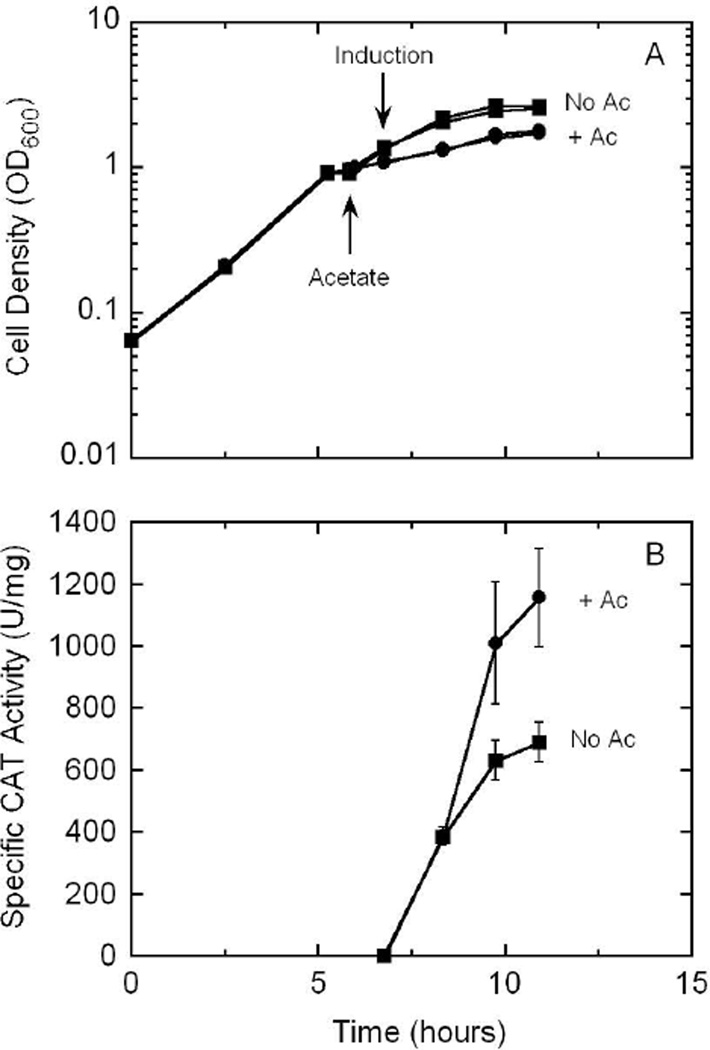
Recently, efforts have been made to improve the properties of Escherichia coli as a recombinant host by 'genomic surgery'-deleting large segments of the E. coli K12 MG1655 genome without scars. These excised segments included K-islands, which contain a high proportion of transposons, insertion sequences, cryptic phage, damaged, and unknown-function genes. The resulting multiple-deletion strain, designated E. coli MDS40, has a 14% (about 700 genes) smaller genome than the parent strain, E. coli MG1655. The multiple-deletion and parent E. coli strains were cultured in fed-batch fermenters to high cell densities on minimal medium to simulate industrial conditions for evaluating growth and recombinant protein production characteristics. Recombinant protein production and by-product levels were quantified at different controlled growth rates. These results indicate that the multiple-deletion strain's growth behavior and recombinant protein productivity closely matched the parent stain. Thus, the multiple-deletion strain E. coli MDS40 provides a suitable foundation for further genomic reduction.
Figures


Similar articles
-
Metabolic engineering of Escherichia coli for 1-butanol production.Metab Eng. 2008 Nov;10(6):305-11. doi: 10.1016/j.ymben.2007.08.003. Epub 2007 Sep 14. Metab Eng. 2008. PMID: 17942358
-
Replacement of the glucose phosphotransferase transport system by galactose permease reduces acetate accumulation and improves process performance of Escherichia coli for recombinant protein production without impairment of growth rate.Metab Eng. 2006 May;8(3):281-90. doi: 10.1016/j.ymben.2006.01.002. Epub 2006 Mar 6. Metab Eng. 2006. PMID: 16517196
-
Improved recombinational stability of lentiviral expression vectors using reduced-genome Escherichia coli.Biotechniques. 2007 Oct;43(4):466, 468, 470. doi: 10.2144/000112585. Biotechniques. 2007. PMID: 18019337
-
Analysis and control of proteolysis of recombinant proteins in Escherichia coli.Adv Biochem Eng Biotechnol. 2004;89:163-95. doi: 10.1007/b95567. Adv Biochem Eng Biotechnol. 2004. PMID: 15217159 Review.
-
Recombinant protein folding and misfolding in Escherichia coli.Nat Biotechnol. 2004 Nov;22(11):1399-408. doi: 10.1038/nbt1029. Nat Biotechnol. 2004. PMID: 15529165 Review.
Cited by
-
Cloning and expression of visfatin and screening of oligopeptides binding with visfatin.Int J Clin Exp Med. 2014 Dec 15;7(12):4828-34. eCollection 2014. Int J Clin Exp Med. 2014. PMID: 25663979 Free PMC article.
-
Bacterial growth laws and their applications.Curr Opin Biotechnol. 2011 Aug;22(4):559-65. doi: 10.1016/j.copbio.2011.04.014. Epub 2011 May 16. Curr Opin Biotechnol. 2011. PMID: 21592775 Free PMC article. Review.
-
Coordinated Changes in Mutation and Growth Rates Induced by Genome Reduction.mBio. 2017 Jul 5;8(4):e00676-17. doi: 10.1128/mBio.00676-17. mBio. 2017. PMID: 28679744 Free PMC article.
-
Industrial production of recombinant therapeutics in Escherichia coli and its recent advancements.J Ind Microbiol Biotechnol. 2012 Mar;39(3):383-99. doi: 10.1007/s10295-011-1082-9. Epub 2012 Jan 18. J Ind Microbiol Biotechnol. 2012. PMID: 22252444 Review.
-
Xylose isomerase improves growth and ethanol production rates from biomass sugars for both Saccharomyces pastorianus and Saccharomyces cerevisiae.Biotechnol Prog. 2012 May-Jun;28(3):669-80. doi: 10.1002/btpr.1535. Biotechnol Prog. 2012. PMID: 22866331 Free PMC article.
References
-
- Akesson M, Karlsson E, Hagander P, Axelsson J, Tocaj A. On-Line detection of acetate formation in Escherichia coli cultures using dissolved oxygen responses to feed transients. Biotechnol. Bioeng. 1999;64:590–598. - PubMed
-
- Andersen DC, Krummen L. Recombinant protein expression for therapeutic applications. Curr. Opin. Biotechnol. 2002;13:117–123. - PubMed
-
- Andersen DC, Swartz J, Ryll T, Lin N, Snedecor B. Metabolic oscillations in an E. coli fermentation. Biotechnol. Bioeng. 2001;75:212–218. - PubMed
-
- Andersson L, Strandberg L, Enfors SO. Cell segregation and lysis have profound effects on the growth of Escherichia coli in high density fed batch cultures. Biotechnol. Prog. 1996;12:190–195. - PubMed
-
- Baneyx F. Recombinant protein expression in Escherichia coli. Curr. Opin. Biotechnol. 1999;10:411–421. - PubMed
Publication types
MeSH terms
Substances
Grants and funding
LinkOut - more resources
Full Text Sources
Other Literature Sources
