. 2007 Feb;22(2):274-85.
doi: 10.1359/jbmr.061110.

Marked disturbance of calcium homeostasis in mice with targeted disruption of the Trpv6 calcium channel gene

Affiliations

Marked disturbance of calcium homeostasis in mice with targeted disruption of the Trpv6 calcium channel gene

Suzy D C Bianco et al. J Bone Miner Res. 2007 Feb.

Abstract

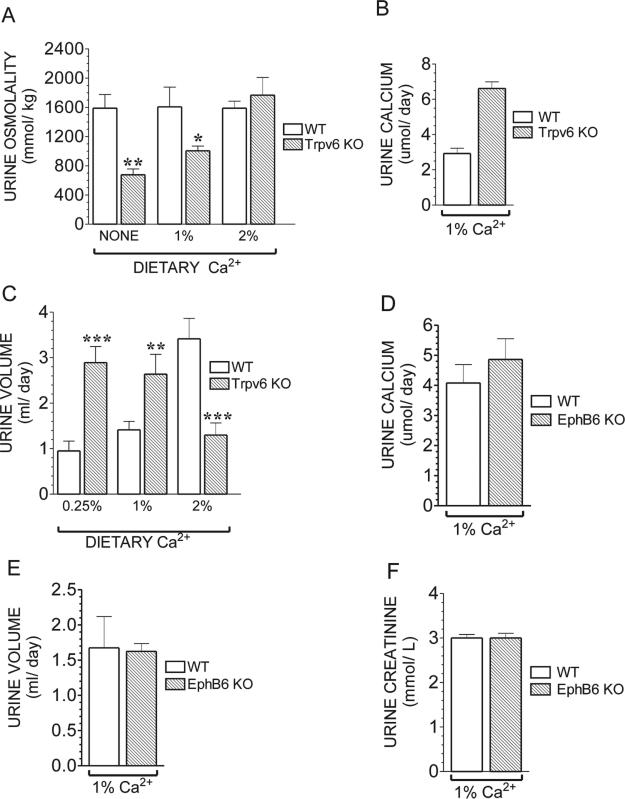
We report the phenotype of mice with targeted disruption of the Trpv6 (Trpv6 KO) epithelial calcium channel. The mice exhibit disordered Ca(2+) homeostasis, including defective intestinal Ca(2+) absorption, increased urinary Ca(2+) excretion, decreased BMD, deficient weight gain, and reduced fertility. Although our Trpv6 KO affects the closely adjacent EphB6 gene, the phenotype reported here is not related to EphB6 dysfunction.

Introduction: The mechanisms underlying intestinal Ca(2+) absorption are crucial for overall Ca(2+) homeostasis, because diet is the only source of all new Ca(2+) in the body. Trpv6 encodes a Ca(2+)-permeable cation channel responsible for vitamin D-dependent intestinal Ca(2+) absorption. Trpv6 is expressed in the intestine and also in the skin, placenta, kidney, and exocrine organs.

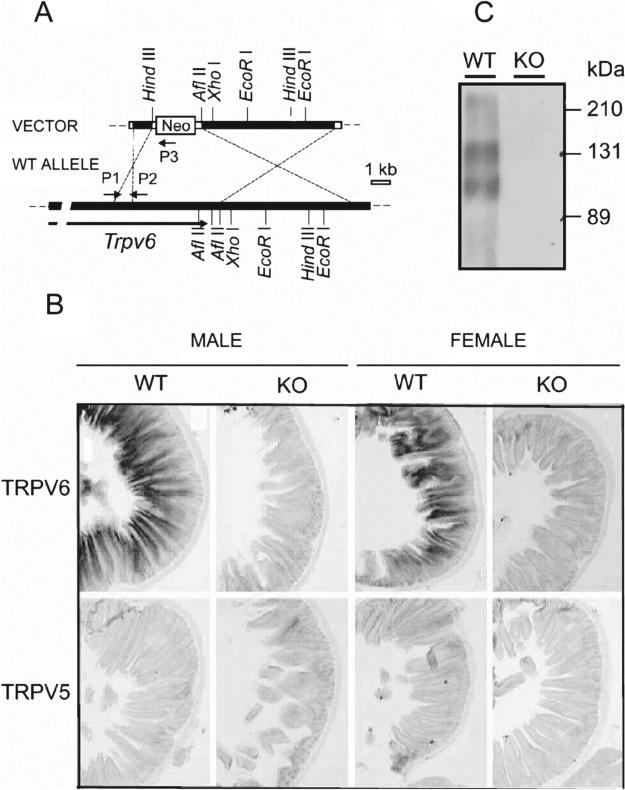
Materials and methods: To determine the in vivo function of TRPV6, we generated mice with targeted disruption of the Trpv6 (Trpv6 KO) gene.

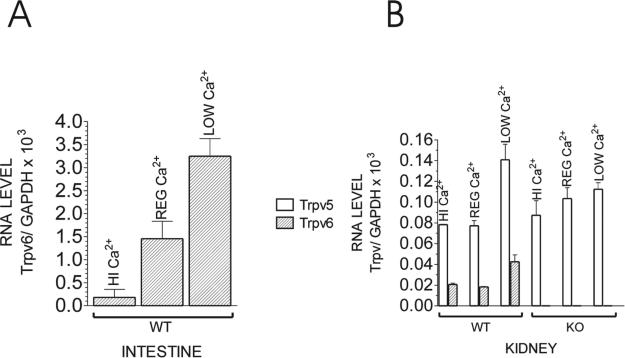
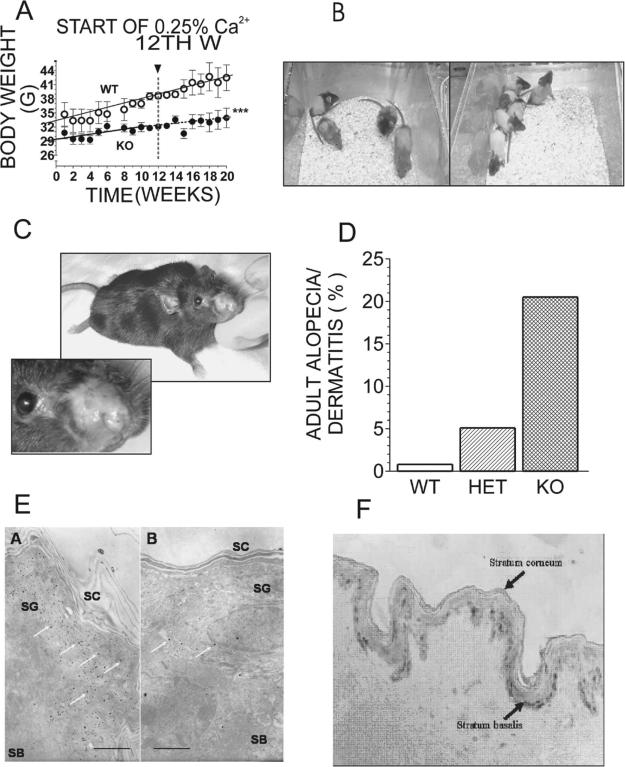
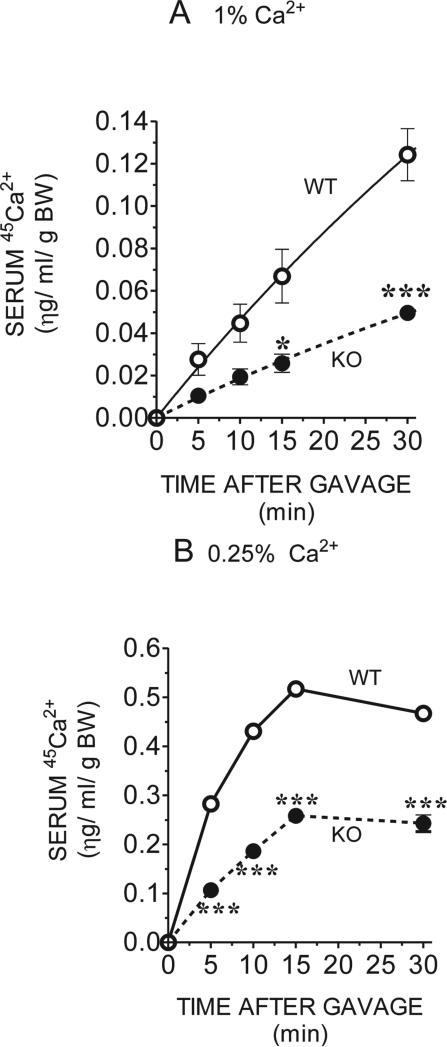
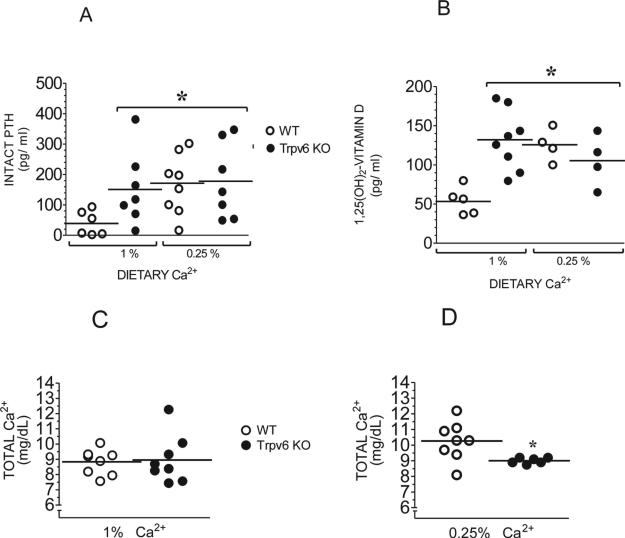
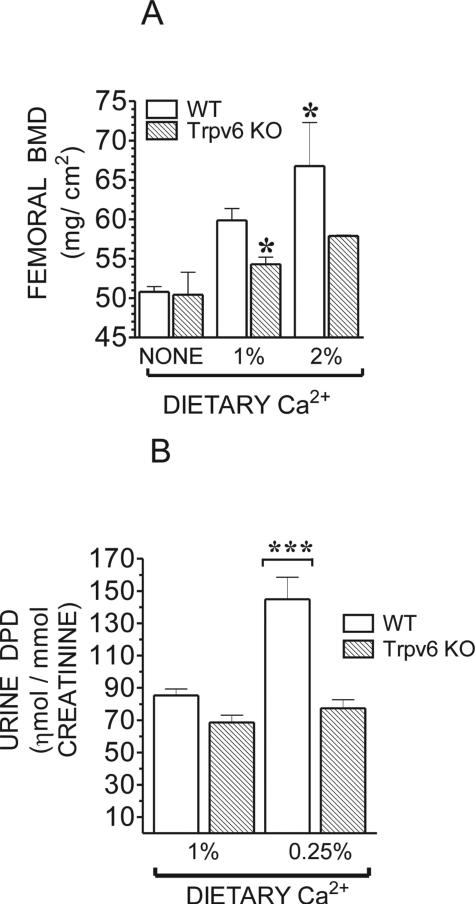
Results: Trpv6 KO mice are viable but exhibit disordered Ca(2+) homeostasis, including a 60% decrease in intestinal Ca(2+) absorption, deficient weight gain, decreased BMD, and reduced fertility. When kept on a regular (1% Ca(2+)) diet, Trpv6 KO mice have deficient intestinal Ca(2+) absorption, despite elevated levels of serum PTH (3.8-fold) and 1,25-dihydroxyvitamin D (2.4-fold). They also have decreased urinary osmolality and increased Ca(2+) excretion. Their serum Ca(2+) is normal, but when challenged with a low (0.25%) Ca(2+) diet, Trpv6 KO mice fail to further increase serum PTH and vitamin D, ultimately developing hypocalcemia. Trpv6 KO mice have normal urinary deoxypyridinoline excretion, although exhibiting a 9.3% reduction in femoral mineral density at 2 months of age, which is not restored by treatment for 1 month with a high (2%) Ca(2+) "rescue" diet. In addition to their deranged Ca(2+) homeostasis, the skin of Trpv6 KO mice has fewer and thinner layers of stratum corneum, decreased total Ca(2+) content, and loss of the normal Ca(2+) gradient. Twenty percent of all Trpv6 KO animals develop alopecia and dermatitis.

Conclusions: Trpv6 KO mice exhibit an array of abnormalities in multiple tissues/organs. At least some of these are caused by tissue-specific mechanisms. In addition, the kidneys and bones of Trpv6 KO mice do not respond to their elevated levels of PTH and 1,25-dihydroxyvitamin D. These data indicate that the TRPV6 channel plays an important role in Ca(2+) homeostasis and in other tissues not directly involved in this process.


Figures

FIG. 1
FIG. 1
(A) Trpv6 targeting vector (top) and predicted product loci (bottom). P1, P2, and P3 indicate the positions of the primers used for genotyping. Filled boxes, exons with coding sequence; open boxes, exons for untranslated sequences (please refer to Materials and Methods section for details on the construction of the targeting vector). (B) In situ hybridization for Trpv6 and Trpv5 in the duodenum of adult wildtype (+) or Trpv6 null mice (−) male (M) or female (F) mice (−/−). (C) Western blot for Trpv6 in the intestine of adult wildtype (+/+) or Trpv6 null mice.
FIG. 2
FIG. 2
Quantitative RT-PCR for (A) Trpv6 in the intestine and (B) Trpv5 and Trpv6 in the kidney of adult WT or Trpv6 KO mice fed the low (0.25%), regular (1%), or high (2%) Ca2+ diet. Each bar is the average of two different mouse samples ± SE and is represented as the ratio of [Trpv/GAPDH] RNA × 103.
FIG. 3
FIG. 3
(A) Weight gain in adult WT or Trpv6 KO mice fed the regular (1% Ca2+) diet. At the 12th week of the experiment, the diet was switched to the low (0.25%) Ca2+ diet. Weight gain was recorded once a week, and the results are the average of 4 mice ± SE. ***p < 0.0001 vs. WT. (B) 25-day-old pups born to Trpv6 +/− mothers bred on the high (2%) Ca2+ diet. (C) Adult (8 months old) Trpv6 KO female with severe dermatitis of the nose. (D) Incidence of alopecia/dermatitis among adult Trpv6 KO mice. Approximately 800 mice born to different combinations of breeding pairs were observed for 1 year. White bar, WT mice; striped bar, heterozygous (Het) mice; black bar, Trpv6 KO (KO) mice. (E) Electron dense deposits of Ca2+ precipitates in normal-appearing skin of adult (a) WT and (b) Trpv6 KO mice. White arrows, electron dense deposits; SG, density of Ca2+ precipitates in the stratum granulosum of the outer epidermis; SB, density of Ca2+ precipitates in the stratum basalis of the inner epidermis; SC, density of Ca2+ precipitates in the stratum corneum. Bars are 2 rm radium. (F) TRPV6 immunostaining in normal skin: Normal-Grid slides of skin tissue were incubated with anti-TRPV6, washed, and incubated with HRP-conjugated second IgG. Immunoreactivity was detected with the DAB-Chromagen system (ABC Elite). Controls for nonspecific immunoreactivity were performed with preimmune serum.
FIG. 4
FIG. 4
Concentration of 45Ca2+ in the serum after oral gavage of adult WT or Trpv6 KO mice fed the (A) regular (1%) or (B) low (0.25%) Ca2+ diet. Blood samples were collected at 0, 5, 10, 15, and 30 minutes after gavaging the mice with 15 μl/g BW of 15 mM Tris, 100 μM CaCl2, 125 mM NaCl2, 1.8 g/liter fructose, and 20 μCi/ml 45Ca. Ten microliters of serum was counted, and 45Ca2+ concentration was calculated by plotting the counts against a 45Ca2+ standard curve. Each point of the 1% Ca2+ curves is the average of five WT and three Trpv6 KO mice; for the 0.25% Ca2+ curves, each point is the average of three WT and two Trpv6 KO mice ± SE. *p < 0.05; ***p < 0.0001 vs. WT controls in the same diet.
FIG. 5
FIG. 5
(A) Intact PTH and (B) 1,25 dihydroxyvitamin D in the serum of adult mice fed the regular (1%) or low (0.25%) Ca2+ diet. Total Ca2+ in the serum of adult WT or Trpv6 KO mice fed a (C) regular (1%) or (D) low (0.25%) Ca2+ diet was assessed by colorimetric assay. Absorbencies were plotted against a standard Ca2+ concentration curve. Results from each group represent the mean ± SE of at least 10 serum samples from different mice. *p < 0.05 vs. WT in regular diet.
FIG. 6
FIG. 6
(A) Urine osmolality in adult WT or Trpv6 KO mice fed a no added Ca2+, regular (1%), or high (2%) Ca2+ diet. Osmolality was measured in a vapor pressure osmometer. Values are the mean ± SE of urine samples from six WT and six Trpv6 KO mice. (B) Urine Ca2+ in adult Trpv6 KO fed a regular Ca2+ diet. Ca2+ concentration was determined by a colorimetric assay. Values are the mean ± SE of urine samples from three WT and three Trpv6 KO mice. (C) Daily urine volume in adult WT or Trpv6 KO mice fed a low (0.25%), regular (1%), or high (2%) Ca2+ diet. Values are the mean ± SE of urine samples from seven WT and seven Trpv6 KO mice. All samples were collected after 3 months of diet treatment. Open bars, WT mice; black bars, Trpv6 KO mice. (D) Daily urine Ca2+ excretion in adult EphB6 KO mice fed a regular diet. (E) Daily urine volume in adult EphB6 KO mice fed a regular Ca2+ diet. (F) Urine creatinine levels in adult EphB6 KO mice fed a regular Ca2+ diet. The urine results from EphB6 mice represent the mean ± SE of urine samples from seven WT (14 samples collected in 2 different days) and four EphB6 KO mice (8 samples collected in 2 different days). *p < 0.05 vs. WT in the same diet; *p < 0.05 or **p < 0.001 vs. WT in the same diet.
FIG. 7
FIG. 7
(A) BMD in adult Trpv6 KO and WT littermates fed a no added Ca2+, regular (1%), or high (2%) Ca2+ diet. BMD was assessed by DXA in the femora of 95-day-old male mice. Values are mean ± SE of three mice. (B) DPD concentration in urine samples from adult WT or Trpv6 KO mice housed overnight in individual metabolic cages and fed a regular (1%) or low (0.25%) Ca2+ diet. Values are the mean ± SE of 10–15 samples collected from 10 mice. *p < 0.05 or ***p < 0.0001 vs. WT in regular diet.

Similar articles

Cited by

References

    1. Frick KK, Bushinsky DA. Molecular mechanisms of primary hypercalciuria. J Am Soc Nephrol. 2003;14:1082–1095. - PubMed
    1. Peng JB, Brown EM, Hediger MA. Epithelial Ca2+ entry channels: Transcellular Ca2+ transport and beyond. J Physiol. 2003;551:729–740. - PMC - PubMed
    1. Peng JB, Brown EM, Hediger MA. Structural conservation of the genes encoding cat1, cat2, and related cation channels. Genomics. 2001;76:99–109. - PubMed
    1. Vennekens R, Hoenderop JG, Prenen J, Stuiver M, Willems PH, Droogmans G, Nilius B, Bindels RJ. Permeation and gating properties of the novel epithelial Ca(2+) channel. J Biol Chem. 2000;275:3963–3969. - PubMed
    1. Song Y, Peng X, Porta A, Takanaga H, Peng JB, Hediger MA, Fleet JC, Christakos S. Calcium transporter 1 and epithelial calcium channel messenger ribonucleic acid are differentially regulated by 1,25 dihydroxyvitamin D3 in the intestine and kidney of mice. Endocrinology. 2003;144:3885–3894. - PubMed

Publication types