. 2007 Apr;158(1):59-70.
doi: 10.1016/j.jsb.2006.10.015. Epub 2006 Oct 24.

Local refinement: an attempt to correct for shrinkage and distortion in electron tomography

Affiliations

Local refinement: an attempt to correct for shrinkage and distortion in electron tomography

Francesca Cantele et al. J Struct Biol. 2007 Apr.

Abstract

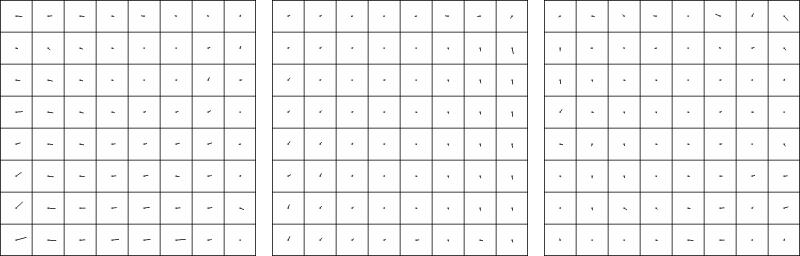
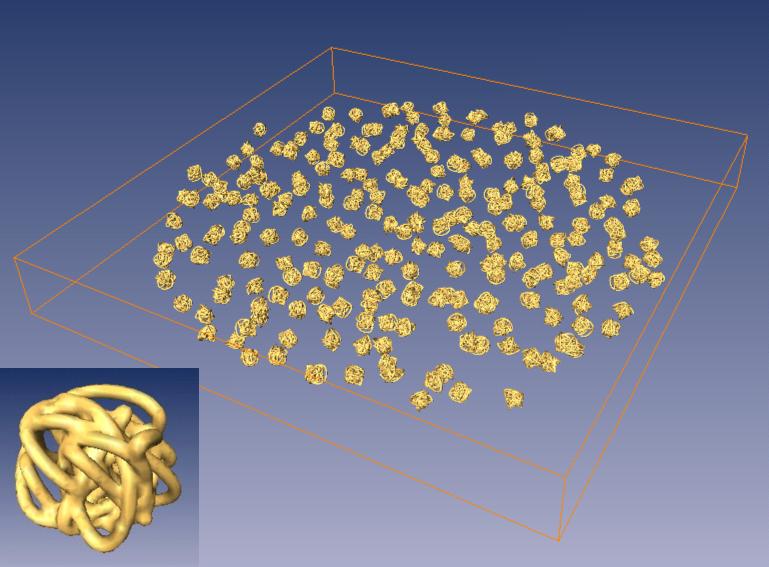
A critical problem in electron tomography is the deformation of the specimen due to radiation, or "shrinkage," which interferes with image alignment and thereby limits resolution. Here, we describe a general strategy for refining preliminary reconstructions which allows the damage due to the shrinkage of plastic-embedded thin sectioned specimens (50-80 nm) to be corrected. The basic steps of the strategy involve: (a) the partition of the preliminary reconstruction into sub-volumes; (b) the extraction of corresponding sub-areas for each sub-volume from the micrographs of the tilt series; (c) the re-projection of each sub-volume according to the orientation parameters; and (d) the refinement of these parameters by correlating each sub-area to the corresponding computed projection. We tested the strategy by refining chemical synapses reconstructed from series imaged with conical, double and single tilt geometries. The results gathered with local refinement were evaluated by visually inspecting the structure of biological membranes in the maps. In an effort to quantify these improvements, we studied the refined maps using correlation criteria and mapped the corrections applied to the orientation parameters in each sub-volume of the reconstruction. Simulation experiments complemented the data gathered by correlation analysis. Based on these criteria, we concluded that local refinement significantly improves the overall quality of the reconstructions of chemical synapses calculated from series imaged with conical and double tilt geometries.


Figures

Figure 1
Figure 1
Local refinement of tomographic maps. The procedure starts in direct space by subdividing the preliminary reconstruction into 64 cubic volumes (A) each of which is treated independently. This processing is illustrated for the generic cube (B), which is shown isolated in the lower left corner of the figure. Working in the projection space (right side of the figure), we extract from the original micrographs the sub-areas from which the sub-volume (B) can be reconstructed. The stack C represents the original micrographs, though only the first projection is shown in full. The elliptical stair of squares represents the sub-areas of the subsequent micrographs containing the data associated with the projection of the cube (B). The vertical axis (n) indicates the order of the projections in series. The position of the squares is computed considering the projection of the center of the cube (B) in the imaging plane during data collection. In conical geometry the projection of every point describes an ellipsis. The sub-areas of the stairs are then organized in a new stack (D). The cube (B) can be reconstructed from (D) using known orientation parameters, because the lay out of Fourier sections in the reciprocal space (E) is the same as for the cube (B) and for the large reconstruction (A). Using the data of the stack (D), the cube (B) is refined as in a standard process of projection matching. Pasting together the refined cubes reconstruct the final volume.
Figure 2
Figure 2
Results of local refinement in conical geometry. The reconstructed volume was inspected by cutting sections along the X-Y, X-Z and Y-Z planes. Before refinement (A, C, E), the unit membrane pattern in the vesicles and plasma membrane is unevenly resolved since alignment was optimized for the center of the maps. After local refinement (B, D, F), the presence of the unit membrane pattern was independent from the location in the map. The larger arrows point to a group of three vesicles where the improvement is most noticeable. The smaller arrows indicate a vesicle of the same group in the X-Z plane
Figure 3
Figure 3
Distortion maps for conical geometry. The three images refer to the first, the middle and the last projection in conical series. The short lines at the center of each small square represent the 64 shift vectors detected by correlating the projections of the cubes with the corresponding regions extracted from the micrograph. For clarity of presentation, the shift vectors are drawn as segments starting from the centre of a set of squares which reproduce the lay out of the 64 cubes. In scale to the edge of the square, the length of the drawn segment is four times the real value. The vectors denote how the specimen warps during shrinkage. The movements follow a non-linear transformation with respect to both the speed of the changes and the shape of the final volume.
Figure 4
Figure 4
Results of local refinement in dual axis geometry. The reconstructed volume was inspected by cutting sections along the X-Y, X-Z and Y-Z planes. Before refinement (A, C, E), the unit membrane pattern in the vesicles and plasma membrane is unevenly resolved since alignment was optimized for the center of the maps. After local refinement (B, D, F), the presence of the unit membrane pattern was independent from the location in the map.
Figure 5
Figure 5
Distortion maps for dual axis geometry. The three images refer to the first, the middle and the last projection of the first the dual axis series. Like in Figure 3, the short lines at the center of each small square represent the 64 shift vectors detected by correlating the projections of the cubes with the corresponding regions extracted from the micrograph. For clarity of presentation, the shift vectors are drawn as segments starting from the centre of a set of squares which reproduce the lay out of the 64 cubes. In scale to the edge of the square, the length of the drawn segment is four times the real value. The vectors denote how the specimen warps during shrinkage. The movements follow a non-linear transformation with respect to both the speed of the changes and the shape of the final volume.
Figure 6
Figure 6
A phantom structure was reconstructed using single, double and conical tilt geometries to assess the quality of the tomograms with regard to anisotropic deformations of the volume. The phantom was comprised of 256 analytically constructed “knots”, randomly oriented and displaced in the slab. An individual knots is shown at the bottom left corner.
Figure 7
Figure 7
Maps of variances obtained from the reconstructed phantom. For each geometry the 256 random knots enclosed within the reconstruction were extracted and aligned with the exact orientation parameters used during the generation of the phantom. The aligned knots were compared pixel by pixel with their average 3D map. The figure presents the variance of the difference maps in common scale: (a) single axis geometry; (b) dual axis; (c) conical geometry. See table 2, columns 3 and 4 (rmsd1).

References

    1. Al-Amoudi A, Norlen LP, Dubochet J. Cryo-electron microscopy of vitreous sections of native biological cells and tissues. J Struct Biol. 2004;148:131–5. - PubMed
    1. Baumeister W. From proteomic inventory to architecture. FEBS letters. 2005;579:933–937. - PubMed
    1. Bellon PL, Lanzavecchia S, Scatturin V. A two exposures technique of electron tomography from projections with random orientations and a quasi-Boolean angular reconstitution. Ultramicroscopy. 1998;72:177–186.
    1. Beck M, Forster F, Ecke M, Plitzko JM, Melchior F, Gerisch G, Baumeister W, Medalia O. Nuclear pore complex structure and dynamics revealed by cryoelectron tomography. Science. 2004;306:1387–90. - PubMed
    1. Cardone G, Grunewald K, Steven AC. A resolution criterion for electron tomography based on cross-validation. J. Struct. Biol. 2005;151:117–129. - PubMed

Publication types

LinkOut - more resources