

doi: 10.1016/j.cell.2006.11.023.
Structural basis of transcription: role of the trigger loop in substrate specificity and catalysis
Affiliations
- PMID: 17129781
- PMCID: PMC1876690
- DOI: 10.1016/j.cell.2006.11.023
Item in Clipboard
Structural basis of transcription: role of the trigger loop in substrate specificity and catalysis
Cell.
.
Abstract
New structures of RNA polymerase II (pol II) transcribing complexes reveal a likely key to transcription. The trigger loop swings beneath a correct nucleoside triphosphate (NTP) in the nucleotide addition site, closing off the active center and forming an extensive network of interactions with the NTP base, sugar, phosphates, and additional pol II residues. A histidine side chain in the trigger loop, precisely positioned by these interactions, may literally "trigger" phosphodiester bond formation. Recognition and catalysis are thus coupled, ensuring the fidelity of transcription.
Figures
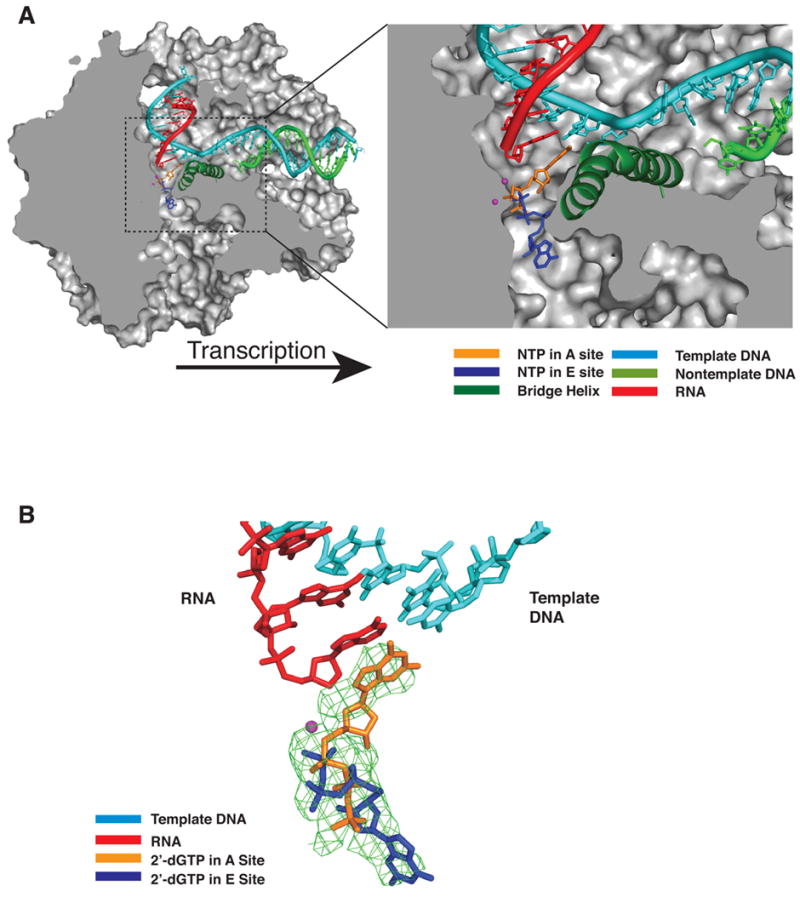
Cutaway view of the pol II transcribing complex. Template DNA, non-template DNA, RNA, GTP in the A site, and ATP in the E site are shown in cyan, green, red, orange, and blue, respectively. The bridge helix (Rpb1 815–848) is in green and Mg2+ ions are shown as magenta spheres. The pol II surface is shown in gray (Westover et al., 2004). (B) Difference electron density map for transcribing complex crystals soaked with 2’-dGTP. An Fo-Fc omit map contoured at 3.0 sigma is shown in green mesh. Template DNA, RNA, 2’-dGTP (A site) and 2’-dGTP (E site) are shown in cyan, red, orange, and blue, respectively.
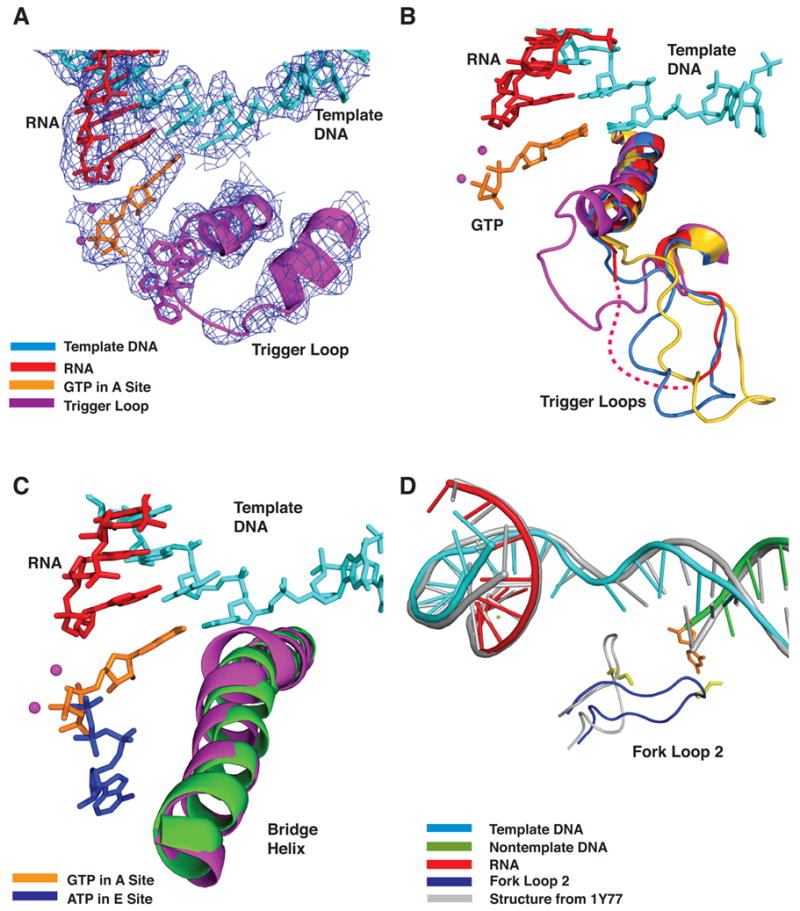
(A) DNA, RNA, trigger loop, and GTP in the A site. The prime_switch map contoured at 1.0 sigma is shown in blue mesh. Template DNA, RNA and GTP are shown in cyan, red, and orange, respectively. The trigger loop is shown in magenta and Mg2+ ions are shown as magenta spheres. (B) Multiple conformations of the trigger loop. Four Pol II transcribing complexes- GTP (A site, low Mg2+) in magenta, ATP (E site, low Mg2+, 1R9T) in red, UTP (E site, high Mg2+) in marine, and pol II-TFIIS (No nucleotide, high Mg2+, 1Y1V) in yellow are superimposed on Cα atoms in the bridge helix and trigger loop. Other colors as in (A). (C) Bridge helix movement in transcribing complex with GTP at low Mg2+ concentration. Pol II transcribing complexes with GTP (low Mg2+) in the A site and with ATP in the E site (1R9T, low Mg2+) are superimposed on Cα atoms in the bridge helix. Template DNA, RNA, GTP (A site) and ATP (E site) are shown in cyan, red, orange and blue, respectively. The bridge helices in GTP (low Mg2+) and 1R9T are shown in magenta and green, respectively. Mg2+ ions are shown as magenta spheres. (D) Fork loop 2 movement. Template DNA, non-template DNA, RNA, and fork loop 2 (Rpb2 502–509) in a pol II transcribing complex with 2’-dGTP at low Mg2+ concentration are cyan, green, red, and blue, respectively. Template DNA, non-template DNA, RNA, and fork loop 2 in a pol II transcribing complex with GMPCPP at high Mg2+ concentration (1Y77) are gray. The side chain of Lys507 is yellow and the nucleotide base at the 5’-end of the non-template strand is orange.
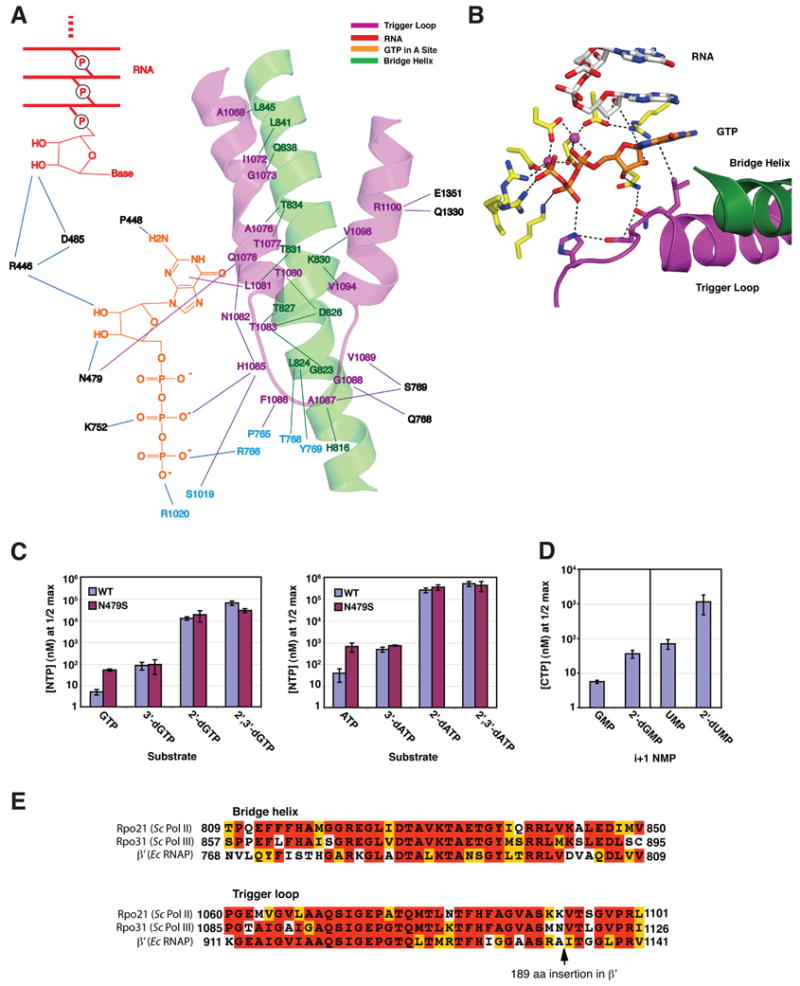
(A) The trigger loop network. Trigger loop and bridge helix are magenta and green, GTP is orange, and the 3’end of the RNA is red. Other residues of Rpb1 and Rpb2 are indicated in black and cyan. (B) Interactions with GTP in the A site. Trigger loop and bridge helix are magenta and green, GTP is orange, and the 3’-end of the RNA is white, except oxygen and nitrogen atoms are highlighted in red and blue. Other residues of Rpb1 and Rpb2 are shown in yellow. (C) Role of Rpb1 Asn479 in selection of the ribose sugar: addition of GTP, ATP and derivatives. Transcribing complexes were formed with wild type and Rpb1 N479S pol II as described for crystallography, with templates specifying addition of either G or A, except with a 9 rather than a 10-residue RNA, which was extended to 10 residues with 32P-radiolabeled NTP. After removal of unincorporated label, complexes were challenged with increasing amounts of template-specified NTP or dNTP derivatives and extension to 11 residues was measured after 5 min (Supplementary Figure 3A). These data were plotted and non-linear regression was performed to determine maximal incorporation of each substrate and the concentration that gave 50% maximal incorporation (apparent KM, Supplementary Figure 3B). Apparent KM values for incorporation of GTP and ATP derivatives by wild type and Rpb1 N479S pol II are shown in the bar graphs. Error bars represent mean +/− standard deviation of at least four apparent KM determinations. (D) Diminished rate of nucleotide addition following incorporation of 2’-dNMP. Apparent KM values for addition of CTP subsequent to incorporation of either GMP, 2’-dGMP, UMP or 2’-dUMP by wild type pol II elongation complexes are shown. Representative gels and data plots are shown in Supplementary Figure 3C,D. Error bars represent mean +/− standard deviation of eight apparent KM determinations. (E) Conservation of bridge helix and trigger loop residues. The sequences of bridge helix and trigger loop from S.cerevisiae Pol II, Pol III (Sc) and E. coli RNA polymerase (Ec RNAP) were aligned using MUSCLE (Edgar, 2004) and then adjusted by hand to account for the 189 aa insertion in E. coli RNAP. Alignment was colored for conservation in MACBOXSHADE.
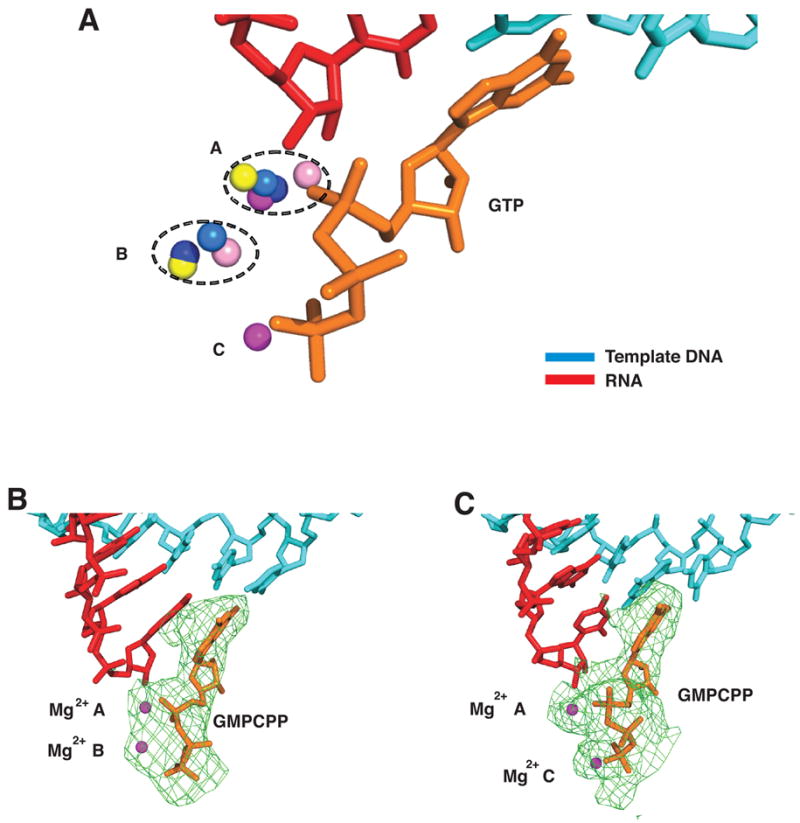
(A) Three Mg2+ ion sites in pol II transcribing complexes. Structures of five pol II transcribing complexes were aligned on phosphates of template DNA and RNA in the active site region. Template DNA, RNA, and GMPCPP at high Mg2+ concentration are cyan, red, and orange, respectively. Mg2+ ions from transcribing complexes (structure, Mg2+ concentration in parentheses) with ATP in the E site (1R9T, low), UTP in the A site (1R9S, low), GTP (Table 1, low), GMPCPP (Table 1, low) and GMPCPP (Table 1, high) are depicted as salmon, blue, yellow, marine, and magenta spheres, respectively. The average distance between metals A and B, B and C, and A and C are 4.0, 4.2, and 5.5 Å, respectively. (B) GMPCPP (orange) in the A site at low Mg2+ concentration. Color code as in Figure 1B. (C) GMPCPP (orange) in the A site at high Mg2+ concentration. Color code as in Figure 1B.
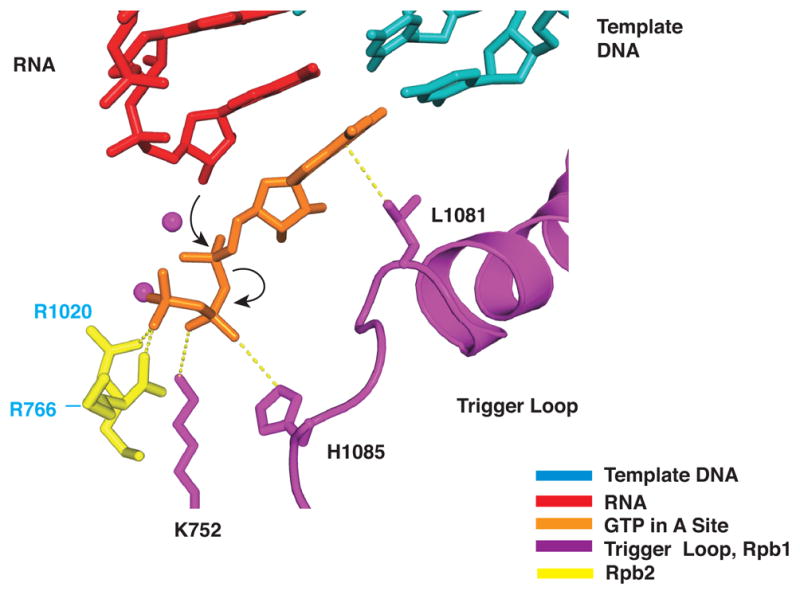
Color code as in Figure 2A, with side chains of Rpb1 Lys752, Rpb1 His1085, Rpb2 Arg1020 (yellow), and Rpb2 Arg766 (yellow). Nucleophilic attack and phosphoanhydride bond breakage are indicated by black arrows.
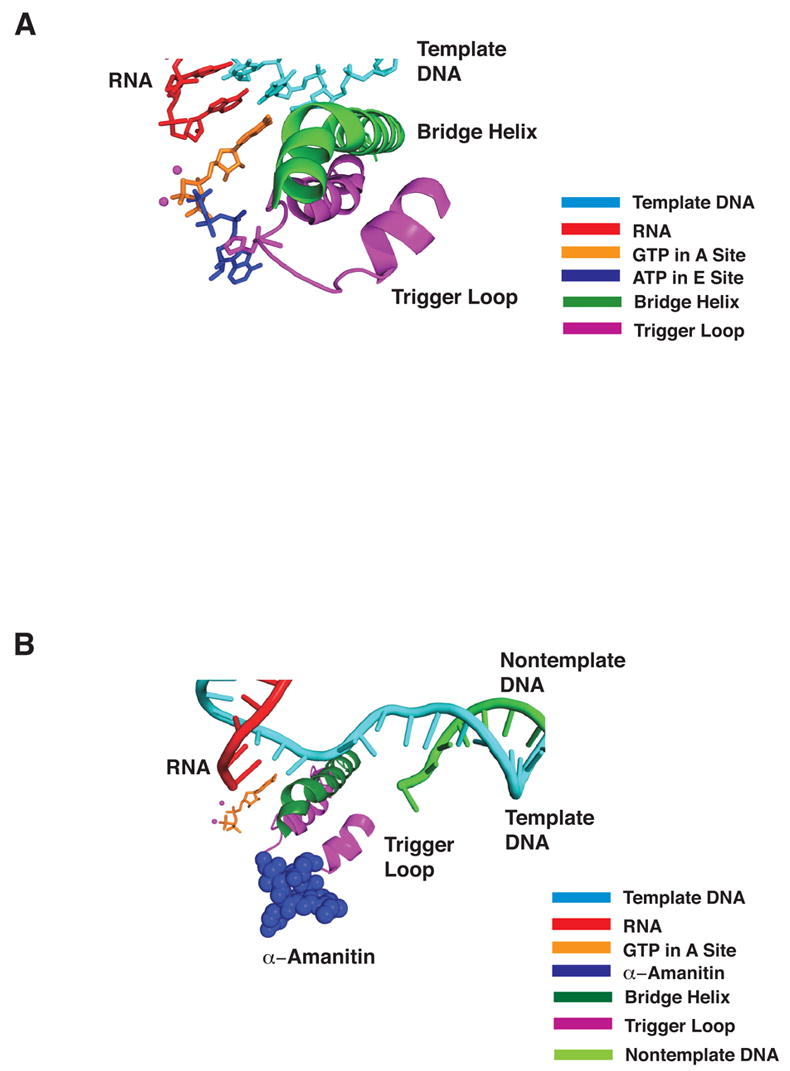
(A) Color code as in Figure 2A, with side chain of trigger loop residue His1085 included and ATP in the E site (1R9T, blue). (B) As in (A) with E site nucleotide omitted and α-amanitin (CPK model in blue, from 1K83) included.
References
-
- Albert DA, Gudas LJ. Ribonucleotide reductase activity and deoxyribonucleoside triphosphate metabolism during the cell cycle of S49 wild-type and mutant mouse T-lymphoma cells. J Biol Chem. 1985;260:679–684. - PubMed
-
- Allison LA, Moyle M, Shales M, Ingles CJ. Extensive homology among the largest subunits of eukaryotic and prokaryotic RNA polymerases. Cell. 1985;42:599–610. - PubMed
-
- Artsimovitch I, Patlan V, Sekine S, Vassylyeva MN, Hosaka T, Ochi K, Yokoyama S, Vassylyev DG. Structural basis for transcription regulation by alarmone ppGpp. Cell. 2004;117:299–310. - PubMed
-
- Bar-Nahum G, Epshtein V, Ruckenstein AE, Rafikov R, Mustaev A, Nudler E. A ratchet mechanism of transcription elongation and its control. Cell. 2005;120:183–193. - PubMed
Publication types
MeSH terms
Substances
Grants and funding
LinkOut - more resources
Full Text Sources
Other Literature Sources
Molecular Biology Databases
