Evidence of the neuron-restrictive silencer factor (NRSF) interaction with Sp3 and its synergic repression to the mu opioid receptor (MOR) gene
- PMID: 17130167
- PMCID: PMC1702488
- DOI: 10.1093/nar/gkl724
Evidence of the neuron-restrictive silencer factor (NRSF) interaction with Sp3 and its synergic repression to the mu opioid receptor (MOR) gene
Abstract
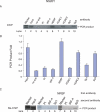
Previously, we reported that the neuron-restrictive silencer element (NRSE) of mu opioid receptor (MOR) functions as a critical regulator to repress the MOR transcription in specific neuronal cells, depending on neuron-restriction silence factor (NRSF) expression levels [C.S.Kim, C.K.Hwang, H.S.Choi, K.Y.Song, P.Y.Law, L.N. Wei and H.H.Loh (2004) J. Biol. Chem., 279, 46464-46473]. Herein, we identify a conserved GC sequence next to NRSE region in the mouse MOR gene. The inhibition of Sp family factors binding to this GC box by mithramycin A led to a significant increase in the endogenous MOR transcription. In the co-immunoprecipitation experiment, NRSF interacted with the full-length Sp3 factor, but not with Sp1 or two short Sp3 isoforms. The sequence specific and functional binding by Sp3 at this GC box was confirmed by in vitro gel-shift assays using either in vitro translated proteins or nuclear extract, and by in vivo chromatin immunoprecipitation assays. Transient transfection assays showed that Sp3-binding site of the MOR gene is a functionally synergic repressor element with NRSE in NS20Y cells, but not in the NRSF negative PC12 cells. The results suggest that the synergic interaction between NRSF and Sp3 is required to negatively regulate MOR gene transcription and that transcription of MOR gene would be governed by the context of available transcription factors rather than by a master regulator.
Figures


Similar articles
-
Neuron-restrictive silencer factor (NRSF) functions as a repressor in neuronal cells to regulate the mu opioid receptor gene.J Biol Chem. 2004 Nov 5;279(45):46464-73. doi: 10.1074/jbc.M403633200. Epub 2004 Aug 18. J Biol Chem. 2004. PMID: 15322094
-
Neuron-restrictive silencer factor functions to suppress Sp1-mediated transactivation of human secretin receptor gene.Biochim Biophys Acta. 2013 Feb;1829(2):231-8. doi: 10.1016/j.bbagrm.2012.11.002. Epub 2012 Nov 17. Biochim Biophys Acta. 2013. PMID: 23168245
-
Transcriptional regulation of mouse mu opioid receptor gene: Sp3 isoforms (M1, M2) function as repressors in neuronal cells to regulate the mu opioid receptor gene.Mol Pharmacol. 2005 May;67(5):1674-83. doi: 10.1124/mol.104.008284. Epub 2005 Feb 9. Mol Pharmacol. 2005. PMID: 15703380
-
Regulation of the cholinergic gene locus by the repressor element-1 silencing transcription factor/neuron restrictive silencer factor (REST/NRSF).Life Sci. 2004 Mar 19;74(18):2213-25. doi: 10.1016/j.lfs.2003.08.045. Life Sci. 2004. PMID: 15017977 Review.
-
Roles of the Neuron-Restrictive Silencer Factor in the Pathophysiological Process of the Central Nervous System.Front Cell Dev Biol. 2022 Mar 1;10:834620. doi: 10.3389/fcell.2022.834620. eCollection 2022. Front Cell Dev Biol. 2022. PMID: 35300407 Free PMC article. Review.
Cited by
-
A proteomics approach for identification of single strand DNA-binding proteins involved in transcriptional regulation of mouse mu opioid receptor gene.Mol Cell Proteomics. 2008 Aug;7(8):1517-29. doi: 10.1074/mcp.M800052-MCP200. Epub 2008 May 2. Mol Cell Proteomics. 2008. PMID: 18453338 Free PMC article.
-
Regulation of mGluR1 expression in human melanocytes and melanoma cells.Biochim Biophys Acta. 2012 Nov-Dec;1819(11-12):1123-31. doi: 10.1016/j.bbagrm.2012.06.005. Epub 2012 Jul 5. Biochim Biophys Acta. 2012. PMID: 22771868 Free PMC article.
-
REST Is Not Resting: REST/NRSF in Health and Disease.Biomolecules. 2023 Oct 2;13(10):1477. doi: 10.3390/biom13101477. Biomolecules. 2023. PMID: 37892159 Free PMC article. Review.
-
Differential use of an in-frame translation initiation codon regulates human mu opioid receptor (OPRM1).Cell Mol Life Sci. 2009 Sep;66(17):2933-42. doi: 10.1007/s00018-009-0082-7. Epub 2009 Jul 16. Cell Mol Life Sci. 2009. PMID: 19609488 Free PMC article.
-
Post-transcriptional regulation of mu-opioid receptor: role of the RNA-binding proteins heterogeneous nuclear ribonucleoprotein H1 and F.Cell Mol Life Sci. 2012 Feb;69(4):599-610. doi: 10.1007/s00018-011-0761-z. Epub 2011 Jul 8. Cell Mol Life Sci. 2012. PMID: 21739230 Free PMC article.
References
-
- Wood P.L. The significance of multiple CNS opioid receptor types: a review of critical considerations relating to technical details and anatomy in the study of central opioid actions. Peptides. 1988;9(Suppl. 1):49–55. - PubMed
-
- Ko J.L., Loh H.H. Poly C binding protein, a single-stranded DNA binding protein, regulates mouse mu-opioid receptor gene expression. J. Neurochem. 2005;93:749–761. - PubMed
-
- Choi H.S., Hwang C.K., Kim C.S., Song K.Y., Law P.Y., Wei L.N., Loh H.H. Transcriptional regulation of mouse mu opioid receptor gene: Sp3 isoforms (M1, M2) function as repressors in neuronal cells to regulate the mu opioid receptor gene. Mol. Pharmacol. 2005;67:1674–1683. - PubMed
-
- Hwang C.K., Kim C.S., Choi H.S., McKercher S.R., Loh H.H. Transcriptional regulation of mouse mu opioid receptor gene by PU.1. J. Biol. Chem. 2004;279:19764–19774. - PubMed
Publication types
MeSH terms
Substances
Grants and funding
- DA011806/DA/NIDA NIH HHS/United States
- DA000564/DA/NIDA NIH HHS/United States
- R01 DA000564/DA/NIDA NIH HHS/United States
- P50 DA011806/DA/NIDA NIH HHS/United States
- R56 DA000564/DA/NIDA NIH HHS/United States
- DA011190/DA/NIDA NIH HHS/United States
- R01 DA001583/DA/NIDA NIH HHS/United States
- DA013926/DA/NIDA NIH HHS/United States
- K02 DA013926/DA/NIDA NIH HHS/United States
- R01 DA011190/DA/NIDA NIH HHS/United States
- K05-DA070554/DA/NIDA NIH HHS/United States
- K05 DA070554/DA/NIDA NIH HHS/United States
- DA001583/DA/NIDA NIH HHS/United States
LinkOut - more resources
Full Text Sources
Other Literature Sources
Molecular Biology Databases
Research Materials
Miscellaneous

