Sequence comparison by sequence harmony identifies subtype-specific functional sites
- PMID: 17130172
- PMCID: PMC1702503
- DOI: 10.1093/nar/gkl901
Sequence comparison by sequence harmony identifies subtype-specific functional sites
Abstract
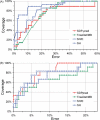
Multiple sequence alignments are often used to reveal functionally important residues within a protein family. They can be particularly useful for the identification of key residues that determine functional differences between protein subfamilies. We present a new entropy-based method, Sequence Harmony (SH) that accurately detects subfamily-specific positions from a multiple sequence alignment. The SH algorithm implements a novel formula, able to score compositional differences between subfamilies, without imposing conservation, in a simple manner on an intuitive scale. We compare our method with the most important published methods, i.e. AMAS, TreeDet and SDP-pred, using three well-studied protein families: the receptor-binding domain (MH2) of the Smad family of transcription factors, the Ras-superfamily of small GTPases and the MIP-family of integral membrane transporters. We demonstrate that SH accurately selects known functional sites with higher coverage than the other methods for these test-cases. This shows that compositional differences between protein subfamilies provide sufficient basis for identification of functional sites. In addition, SH selects a number of sites of unknown function that could be interesting candidates for further experimental investigation.
Figures


Similar articles
-
Sequence harmony: detecting functional specificity from alignments.Nucleic Acids Res. 2007 Jul;35(Web Server issue):W495-8. doi: 10.1093/nar/gkm406. Epub 2007 Jun 21. Nucleic Acids Res. 2007. PMID: 17584793 Free PMC article.
-
Multi-Harmony: detecting functional specificity from sequence alignment.Nucleic Acids Res. 2010 Jul;38(Web Server issue):W35-40. doi: 10.1093/nar/gkq415. Epub 2010 Jun 4. Nucleic Acids Res. 2010. PMID: 20525785 Free PMC article.
-
Assessing the ability of sequence-based methods to provide functional insight within membrane integral proteins: a case study analyzing the neurotransmitter/Na+ symporter family.BMC Bioinformatics. 2007 Oct 17;8:397. doi: 10.1186/1471-2105-8-397. BMC Bioinformatics. 2007. PMID: 17941992 Free PMC article.
-
TreeDet: a web server to explore sequence space.Nucleic Acids Res. 2006 Jul 1;34(Web Server issue):W110-5. doi: 10.1093/nar/gkl203. Nucleic Acids Res. 2006. PMID: 16844971 Free PMC article.
-
Practical analysis of specificity-determining residues in protein families.Brief Bioinform. 2016 Mar;17(2):255-61. doi: 10.1093/bib/bbv045. Epub 2015 Jul 2. Brief Bioinform. 2016. PMID: 26141829 Review.
Cited by
-
Ensemble approach to predict specificity determinants: benchmarking and validation.BMC Bioinformatics. 2009 Jul 2;10:207. doi: 10.1186/1471-2105-10-207. BMC Bioinformatics. 2009. PMID: 19573245 Free PMC article.
-
Recognition of sites of functional specialisation in all known eukaryotic protein kinase families.PLoS Comput Biol. 2018 Feb 13;14(2):e1005975. doi: 10.1371/journal.pcbi.1005975. eCollection 2018 Feb. PLoS Comput Biol. 2018. PMID: 29438395 Free PMC article.
-
Characterization and prediction of residues determining protein functional specificity.Bioinformatics. 2008 Jul 1;24(13):1473-80. doi: 10.1093/bioinformatics/btn214. Epub 2008 May 1. Bioinformatics. 2008. PMID: 18450811 Free PMC article.
-
Predicting the Specificity- Determining Positions of Receptor Tyrosine Kinase Axl.Front Mol Biosci. 2021 Jun 14;8:658906. doi: 10.3389/fmolb.2021.658906. eCollection 2021. Front Mol Biosci. 2021. PMID: 34195226 Free PMC article.
-
Identification of specificity determining residues in peptide recognition domains using an information theoretic approach applied to large-scale binding maps.BMC Biol. 2011 Aug 11;9:53. doi: 10.1186/1741-7007-9-53. BMC Biol. 2011. PMID: 21835011 Free PMC article.
References
-
- Livingstone C.D., Barton G.J. Identification of functional residues and secondary structure from protein multiple sequence alignment. Methods Enzymol. 1996;266:497–512. - PubMed
-
- Lichtarge O., Bourne H.R., Cohen F.E. An evolutionary trace method defines binding surfaces common to protein families. J. Mol. Biol. 1996;257:342–358. - PubMed
-
- Kuipers W., Oliveira L., Vriend G., Ijzerman A.P. Identification of class-determining residues in G protein-coupled receptors by sequence analysis. Recept. Channels. 1997;5:159–174. - PubMed
-
- Hannenhalli S.S., Russell R.B. Analysis and prediction of functional sub-types from protein sequence alignments. J. Mol. Biol. 2000;303:61–76. - PubMed
-
- Mirny L.A., Gelfand M.S. Using orthologous and paralogous proteins to identify specificity-determining residues in bacterial transcription factors. J. Mol. Biol. 2002;321:7–20. - PubMed

