

The effect of intensive glycemic treatment on coronary artery calcification in type 1 diabetic participants of the Diabetes Control and Complications Trial/Epidemiology of Diabetes Interventions and Complications (DCCT/EDIC) Study
- PMID: 17130504
- PMCID: PMC2701297
- DOI: 10.2337/db06-0653
The effect of intensive glycemic treatment on coronary artery calcification in type 1 diabetic participants of the Diabetes Control and Complications Trial/Epidemiology of Diabetes Interventions and Complications (DCCT/EDIC) Study
Abstract
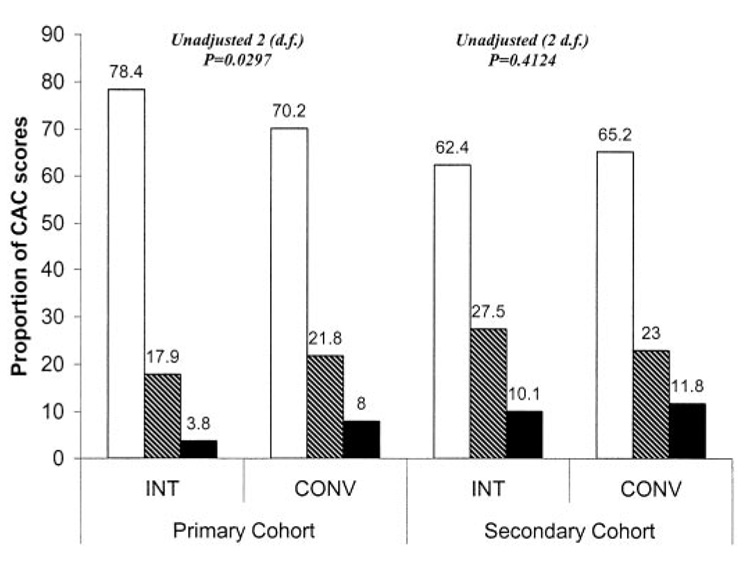
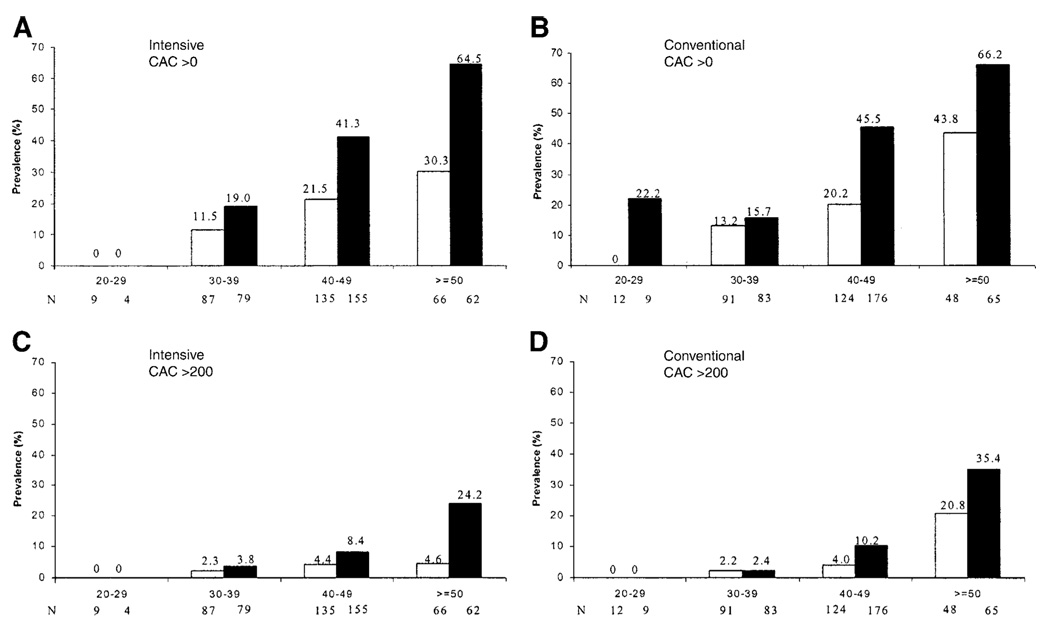
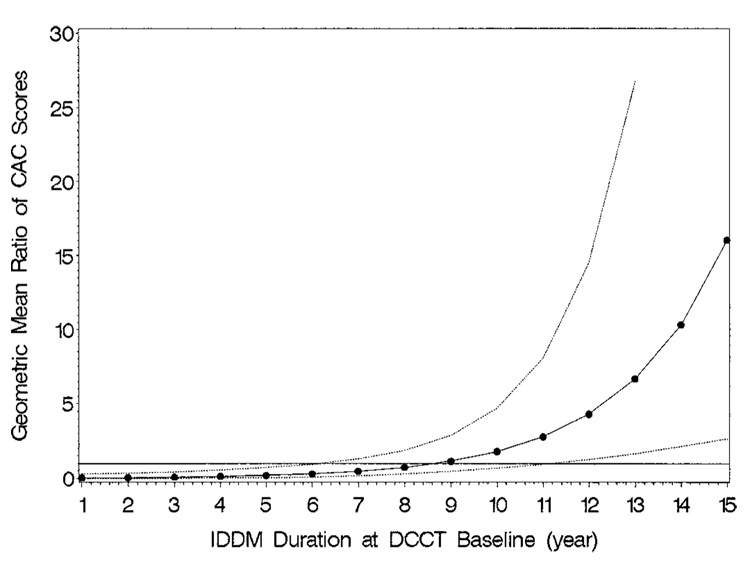
The Epidemiology of Diabetes Interventions and Complications (EDIC) study, an observational follow-up of the Diabetes Control and Complications Trial (DCCT) type 1 diabetes cohort, measured coronary artery calcification (CAC), an index of atherosclerosis, with computed tomography (CT) in 1,205 EDIC patients at approximately 7-9 years after the end of the DCCT. We examined the influence of the 6.5 years of prior conventional versus intensive diabetes treatment during the DCCT, as well as the effects of cardiovascular disease risk factors, on CAC. The prevalences of CAC >0 and >200 Agatston units were 31.0 and 8.5%, respectively. Compared with the conventional treatment group, the intensive group had significantly lower geometric mean CAC scores and a lower prevalence of CAC >0 in the primary retinopathy prevention cohort, but not in the secondary intervention cohort, and a lower prevalence of CAC >200 in the combined cohorts. Waist-to-hip ratio, smoking, hypertension, and hypercholesterolemia, before or at the time of CT, were significantly associated with CAC in univariate and multivariate analyses. CAC was associated with mean HbA(1c) (A1C) levels before enrollment, during the DCCT, and during the EDIC study. Prior intensive diabetes treatment during the DCCT was associated with less atherosclerosis, largely because of reduced levels of A1C during the DCCT.
Figures
References
-
- Krolewski AS, Kosinski EJ, Warram JH, Leland OS, Busick EJ, Asmal AC, et al. Magnitude and determinants of coronary artery disease in juvenile-onset, insulin-dependent diabetes mellitus. Am J Cardiol. 1987;59:750–755. - PubMed
-
- Dorman JS, Laporte RE, Kuller LH, Cruickshanks KJ, Orchard TJ, Wagener DK, Becker DJ, Cavender DE, Drash AL. The Pittsburgh insulin-dependent diabetes mellitus (IDDM) morbidity and mortality study: mortality results. Diabetes. 1984;33:271–276. - PubMed
-
- Orchard TJ, Olson JC, Erbey JR, Williams K, Forrest KY, Smithline Kinder L, Ellis D, Becker DJ. Insulin resistance-related factors, but not glycemia, predict coronary artery disease in type 1 diabetes: 10-year follow-up data from the Pittsburgh Epidemiology of Diabetes Complications Study. Diabetes Care. 2003;26:1374–1379. - PubMed
-
- Forrest KY, Becker DJ, Kuller LH, Wolfson SK, Orchard TJ. Are predictors of coronary heart disease and lower-extremity arterial disease in type 1 diabetes the same? A prospective study. Atherosclerosis. 2000;148:159–169. - PubMed
-
- Koivisto VA, Stevens LK, Mattock M, Ebeling P, Muggeo M, Stephenson J, Idzior-Walus B. Cardiovascular disease and its risk factors in IDDM in Europe: EURODIAB IDDM Complications Study Group. Diabetes Care. 1996;19:689–697. - PubMed
Publication types
MeSH terms
Substances
Grants and funding
LinkOut - more resources
Full Text Sources
Medical
Miscellaneous
