. 2006 Dec;128(6):731-44.
doi: 10.1085/jgp.200609596.

An S6 mutation in BK channels reveals beta1 subunit effects on intrinsic and voltage-dependent gating

Affiliations

An S6 mutation in BK channels reveals beta1 subunit effects on intrinsic and voltage-dependent gating

Bin Wang et al. J Gen Physiol. 2006 Dec.

Abstract

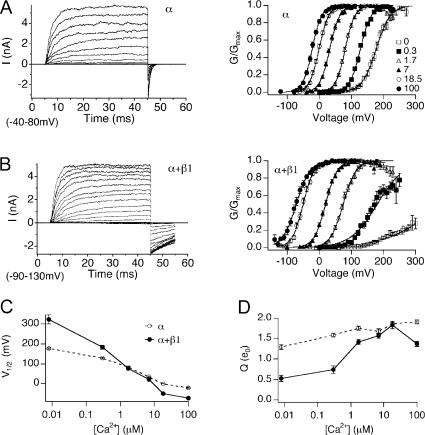
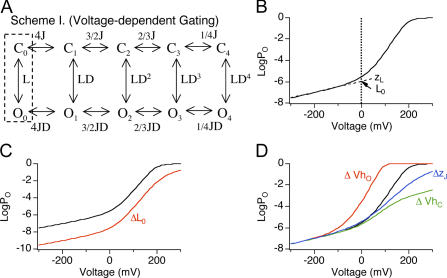
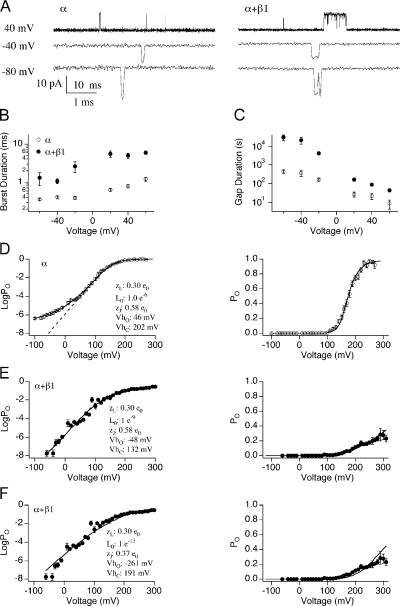
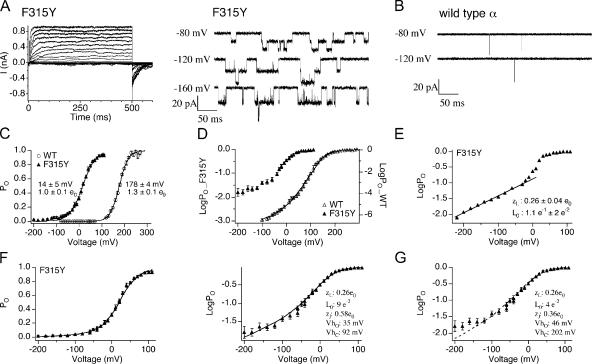
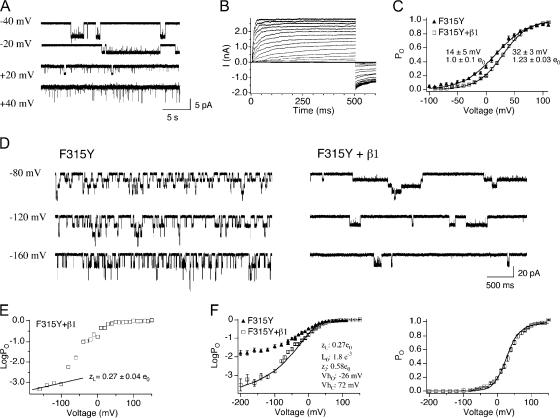
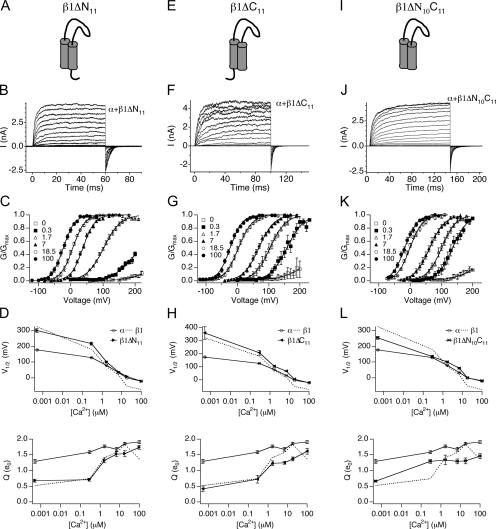
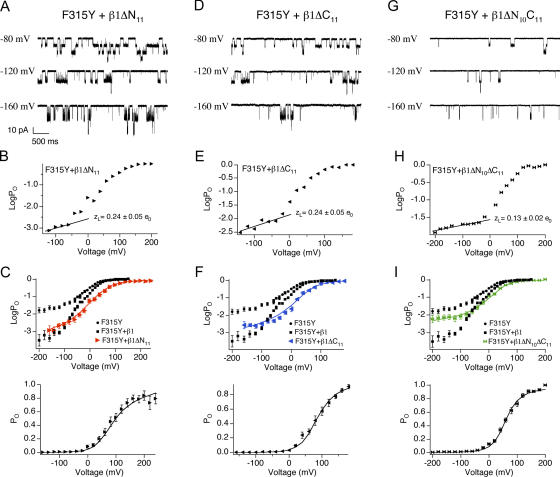
Large conductance, Ca(2+)- and voltage-activated K(+) (BK) channels are exquisitely regulated to suit their diverse roles in a large variety of physiological processes. BK channels are composed of pore-forming alpha subunits and a family of tissue-specific accessory beta subunits. The smooth muscle-specific beta1 subunit has an essential role in regulating smooth muscle contraction and modulates BK channel steady-state open probability and gating kinetics. Effects of beta1 on channel's gating energetics are not completely understood. One of the difficulties is that it has not yet been possible to measure the effects of beta1 on channel's intrinsic closed-to-open transition (in the absence of voltage sensor activation and Ca(2+) binding) due to the very low open probability in the presence of beta1. In this study, we used a mutation of the alpha subunit (F315Y) that increases channel openings by greater than four orders of magnitude to directly compare channels' intrinsic open probabilities in the presence and absence of the beta1 subunit. Effects of beta1 on steady-state open probabilities of both wild-type alpha and the F315Y mutation were analyzed using the dual allosteric HA model. We found that mouse beta1 has two major effects on channel's gating energetics. beta1 reduces the intrinsic closed-to-open equilibrium that underlies the inhibition of BK channel opening seen in submicromolar Ca(2+). Further, P(O) measurements at limiting slope allow us to infer that beta1 shifts open channel voltage sensor activation to negative membrane potentials, which contributes to enhanced channel opening seen at micromolar Ca(2+) concentrations. Using the F315Y alpha subunit with deletion mutants of beta1, we also demonstrate that the small N- and C-terminal intracellular domains of beta1 play important roles in altering channel's intrinsic opening and voltage sensor activation. In summary, these results demonstrate that beta1 has distinct effects on BK channel intrinsic gating and voltage sensor activation that can be functionally uncoupled by mutations in the intracellular domains.


Figures

Figure 1.
Figure 1.
The mβ1 subunit promotes BK channel activation in high Ca2+ and reduces channel activation in low Ca2+. (A) Left, families of BK/α currents evoked by 40-ms depolarizations (20-mV steps over the indicated range) in 7 μM Ca2+. Right, normalized G-V relationships (mean ± SEM) of BK/α at indicated Ca2+ (n = 12–44). (B) Left, families of BK/α+β1 currents evoked by 40-ms depolarizations (20-mV steps over the indicated range) in 7 μM Ca2+. Right, normalized G-V relationships (mean ± SEM) of BK/α+β1 at indicated Ca2+ (n = 7–39). (C) V1/2-Ca2+ relationships (mean ± SEM) for BK/α (open symbols) and BK/α+β1 channels (closed symbols). (D) Q-Ca2+ relationships (mean ± SEM) for BK/α (open symbols) and BK/α+β1 channels (closed symbols).
Figure 2.
Figure 2.
Effects on 0 Ca2+ logPO-V relation by changes in L0, VhO, VhC, and zJ. (A) BK channel gating scheme at 0 Ca2+ according to the HA model. Channel resides in either open (O) or closed (C) conformation, with zero to four (subscripts) activated (A) voltage sensors. L is the C-O equilibrium constant with all four voltage sensors in the resting (R) state (dashed box). J is the R-A equilibrium constant when channels are closed. D is the allosteric interaction factor between C-O transition and voltage sensor activation. Equilibrium between C-O transitions is allosterically regulated by the states of four independent and identical voltage sensors. (B) Simulated 0 Ca2+ logPO-V relation according to the HA model (L0 = 1 e−6, zL = 0.30 e0, zJ = 0.58 e0, VhC = +200 mV, VhO = +50 mV). Dashed line represents linear fit of the logPO-V relation at the limiting slope. L0 (point where dashed line and zero line cross) and zL (slope of dashed line) are the zero voltage value of L and its partial charge, respectively. (C) Effects on logPO-V relation of changing L0 from 1 e−6 (black) to 1 e−8 (red). Notice the shift of the limiting slope along the Y axis. (D) Effects on logPO-V relation of changing VhO (−50 mV, red), VhC (+100 mV, green), or zJ (0.4 e0, blue) and leaving other parameters the same as in B (black). Notice reducing VhO, but not VhC or zJ shifts the steep phase of the logPO-V relation to more hyperpolarized potentials.
Figure 3.
Figure 3.
Evaluating effects of mβ1 on L0 and VhO in the presence of wild type α. (A) Representative single channel currents of BK/α (left) and BK/α+β1 (right) in 0 Ca2+. Time scales are 10 ms for +40 mV and 1 ms for −40 and −80 mV, respectively. (B) Burst duration (mean ± SEM) versus voltage for BK/α (n = 5–10) and for BK/α+β1 (n = 3–13). (C) Gap duration (mean ± SEM) versus voltage for BK/α (n = 5–10) and for BK/α+β1 (n = 3–13). (D) LogPO-V (mean ± SEM, left) and PO-V relations (mean ± SEM, right panel) of BK/α. PO between −120 and +100 mV were measured using single channel recordings (n = 2–13). PO between +110 and +290 mV were measured using macroscopic recordings (n = 12). Linear fit of logPO–V relation at the “steep phase” (dashed line, left) indicates that the measurement either has reached or is approaching the limiting slope. The solid line represents best fits to the HA model (held zL = 0.3 e0, zJ = 0.58 e0, fitting yielded L0 = 1 e−6, VhC = +202 mV, and VhO = 46 mV). (E) LogPO-V (mean ± SEM, left) and PO-V relations (mean ± SEM, right) of BK/α+β1. PO between −60 and +80 mV were measured using single channel recordings (n = 4–22). PO between +90 and +310 mV were measured using macroscopic recordings (n = 7). Linear fit of logPO–V relation at the “steep phase” (dashed line, left panel overlaps with the solid line) indicates that the measurement has not reached the limiting slope. Fits to the HA model were not well constrained, reasonable fits were obtained when L0 ranged between 1 e−10 and 1 e−8. The solid line represents one of the fits (held L0 = 1 e−9, zL = 0.3 e0, zJ = 0–0.58 e0, fitting yielded VhC = +132 mV and VhO = −48 mV). (F) Reducing zJ did not improve the fits. Best fits (solid lines) to the HA model (held zJ = 0.37 e0, zL = 0.3 e0, L0 > 1 e−13, yielded L0 = 1e−13, VhC = +192 mV, and VhO = −261 mV).
Figure 4.
Figure 4.
F315Y mutation greatly increases PO at 0 Ca2+ by increasing L0. (A) Representative macroscopic (left) and single channel (right) recordings of BK/F315Y at 0 Ca2+. (B) Representative single channel currents of BK/α at 0 Ca2+ show opening to be much briefer than the F315Y mutant. (C) G-V relations (mean ± SEM) for BK/α (n = 12) and BK/F315Y (n = 13). F315Y mutation left shifts G-V and decreases the apparent voltage dependence. (D) LogPO-V relations (mean ± SEM) for BK/α (n = 3–12) and BK/F315Y (n = 4–7). (E) Representative logPO-V relations of BK/F315Y where the limiting slope was fitted to Eq. 4 to estimate zL and L0 values (mean ± SEM) are indicated in the figure (n = 6). (F) Best fits to the HA model (held zJ = 0–0.58 e0, zL = 0.26 e0, yielded L0 = 9 e−2, zJ = 0.58 e0, VhC = +92 mV, and VhO = +35 mV). (G) Best fits to the HA model assuming F315Y does not alter VhC and VhO (held zL = 0.26 e0, VhC = +202 mV, and VhO = +46 mV, yielded L0 = 4 e−2, zJ = 0.36 e0).
Figure 5.
Figure 5.
Evaluating effects of mβ1 on L0 and VhO in the presence of F315Y. (A) An example of single channel recordings of BK/F315Y+β1 at 0 Ca2+. Notice that maximum PO reaches ∼1. (B) Representative macroscopic recordings of BK/F315Y+β1 at 0 Ca2+. (C) G-V relation (mean ± SEM) for BK/F315Y (n = 13) and BK/F315Y+β1 (n = 28). (D) Representative single channel recordings for BK/F315Y and BK/F315Y+β1. Notice that β1 dramatically increases the burst durations. (E) Representative logPO-V relations of BK/F315Y+β1 where the limiting slope were fitted to Eq. 4 to estimate zL, and L0 values indicated in the figure represent mean ± SEM (n = 7). (F) Best fits to the HA model (held zJ = 0.58 e0, zL = 0.27 e0 yielded L0 = 1.8 e−3, VhC = +72 mV, and VhO = −26 mV).
Figure 6.
Figure 6.
Effects on V1/2-Ca2+ relations of changing L0, VhO, or J0. (A) Effects on V1/2-Ca2+ and Q-Ca2+ relations by changing L0. PO-V relations were simulated based on the HA model and fitted to the Boltzmann function to obtain V1/2-Ca2+ relations. Gating parameters were the same (zL = 0.30 e0, zJ = 0.58 e0, VhC = +200 mV, VhO = +50 mV, KC = 13 μM, KC = 1.3 μM) except for L0 (L0 = 1 e−6, black line; L0 = 1 e−8, orange line; L0 = 1 e−9, red line). (B) Effects on V1/2-Ca2+ and Q-Ca2+ relations by changing L0 when VhC is +400 mV. Gating parameters are same as A except VhC is +400 mV. (C) Effects on V1/2-Ca2+ and Q-Ca2+ relations by changing VhO or J0. Gating parameters were the same (zL = 0.30 e0, L0 = 1 e−6, zJ = 0.58 e0, KC = 13 μM, KC = 1.3 μM) except for VhC and VhO, (VhC = +200 mV, VhO = +50 mV, black line; VhC = +200 mV, VhO = −20 mV, solid green line, VhC = +130 mV, VhO = −20 mV, green dash line). (D) Effects on V1/2-Ca2+ relations by changing JO and L0. Black lines (L0 = 1 e−6, VhC = +200 mV, VhO = +50 mV, other parameters as in A); blue line, left (L0 = 1 e−9, VhC = +130 mV, VhO = −20 mV); blue line, right (L0 = 1 e−8, VhC = +130 mV, VhO = −20 mV).
Figure 7.
Figure 7.
Intracellular domain deletions of β1 eliminate the leftward shift of the G-V relationship at high Ca2+. (A) Cartoon of the β1ΔN11 mutant. (B) Families of BK/α+β1ΔN11 currents evoked by 60-ms depolarizations in 7 μM Ca2+. (C) Normalized G-V relationships (mean ± SEM) of BK/α+β1ΔN11 at indicated Ca2+ (n = 5–18). (D) V1/2-Ca2+ and Q-Ca2+ relationships (mean ± SEM) for BK/α+β1ΔN11 compared with BK/α and BK/α+β1. (E) Cartoon of the β1ΔC11 mutant. (F) Families of BK/α+β1ΔC11 currents evoked by 90-ms depolarizations in 7 μM Ca2+. (G) Normalized G-V relationships (mean ± SEM) of BK/α+β1ΔC11 at indicated Ca2+ (n = 4–26). (H) V1/2-Ca2+ and Q-Ca2+ relationships (mean ± SEM) for BK/α+β1ΔC11 compared with BK/α and BK/α+β1. (I) Cartoon of the β1ΔN10ΔC11 mutant. (J) Families of BK/α+β1ΔN10ΔC11 currents evoked by 150-ms depolarizations in 7 μM Ca2+. (K) Normalized G-V relationships (mean ± SEM) of BK/α+β1ΔN10ΔC11 at indicated Ca2+ (n = 3–14). (L) V1/2-Ca2+ and Q-Ca2+ relationships (mean ± SEM) for BK/α+β1ΔN10ΔC11 compared with BK/α and BK/α+β1.
Figure 8.
Figure 8.
Intracellular domain deletions impair β1's ability to reduce L0 and shift VhO. (A) Examples of single channel currents of BK/F315Y+β1ΔN11. (B) Representative logPO-V relations of BK/α+β1ΔN11 where the limiting slope were fitted to Eq. 4 to estimate zL. zL values indicated in the figure represent mean ± SEM (n = 8). (C) Best fits to the HA model (held zL = 0.24 e0, zJ = 0–0.58 e0, yielded L0 = 5.5e−3, zJ = 0.58 e0, VhC = +69 mV, and VhO = +15 mV). (D) Examples of single channel currents of BK/F315Y+β1ΔC11. (E) Representative logPO-V relations of BK/α+β1ΔC11 where the limiting slope was fitted to Eq. 4 to estimate zL. zL value indicated in the figure represents mean ± SEM (n = 5). (F) Best fits to the HA model (held zL = 0.24 e0, zJ = 0–0.58 e0, yielded L0 = 8 e−3, zJ = 0.58 e0, VhC = +103 mV and VhO = +43 mV). (G) Examples of single channel currents of BK/F315Y+β1ΔN10C11. (H) Representative logPO-V relations of BK/F315Y+β1ΔN10C11 where the limiting slope was fitted to Eq. 4 to estimate zL. zL values indicated in the figure represent mean ± SEM (n = 8). (I) Best fits to the HA model (held zL = 0.13 e0, zJ = 0–0.58 e0, yielded L0 = 1.3 e−2, zJ = 0.58 e0, VhC = +98 mV, and VhO = +29 mV).

Similar articles

Cited by

References

    1. Bao, L., and D.H. Cox. 2005. Gating and ionic currents reveal how the BKCa channel's Ca2+ sensitivity is enhanced by its β1 subunit. J. Gen. Physiol. 126:393–412. - PMC - PubMed
    1. Brenner, R., T.J. Jegla, A. Wickenden, Y. Liu, and R.W. Aldrich. 2000. a. Cloning and functional characterization of novel large conductance calcium-activated potassium channel β subunits, hKCNMB3 and hKCNMB4. J. Biol. Chem. 275:6453–6461. - PubMed
    1. Brenner, R., G.J. Perez, A.D. Bonev, D.M. Eckman, J.C. Kosek, S.W. Wiler, A.J. Patterson, M.T. Nelson, and R.W. Aldrich. 2000. b. Vasoregulation by the β1 subunit of the calcium-activated potassium channel. Nature. 407:870–876. - PubMed
    1. Brenner, R., Q.H. Chen, A. Vilaythong, G.M. Toney, J.L. Noebels, and R.W. Aldrich. 2005. BK channel β4 subunit reduces dentate gyrus excitability and protects against temporal lobe seizures. Nat. Neurosci. 8:1752–1759. - PubMed
    1. Butler, A., S. Tsunoda, D.P. McCobb, A. Wei, and L. Salkoff. 1993. mSlo, a complex mouse gene encoding “maxi” calcium-activated potassium channels. Science. 261:221–224. - PubMed

Publication types

MeSH terms

Substances