. 2006:2:65.
doi: 10.1038/msb4100106. Epub 2006 Nov 28.

Communication between levels of transcriptional control improves robustness and adaptivity

Affiliations

Communication between levels of transcriptional control improves robustness and adaptivity

Alexander M Tsankov et al. Mol Syst Biol. 2006.

Abstract

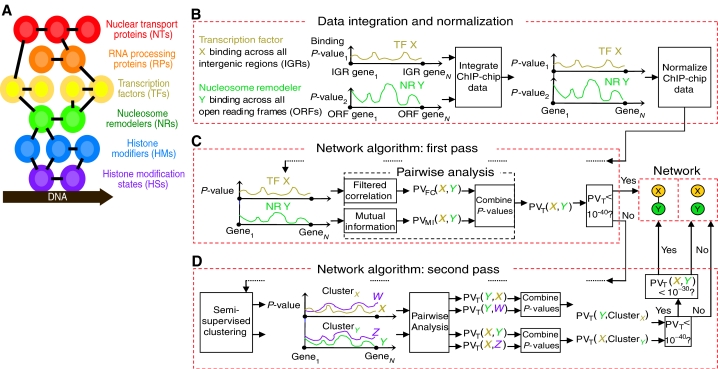
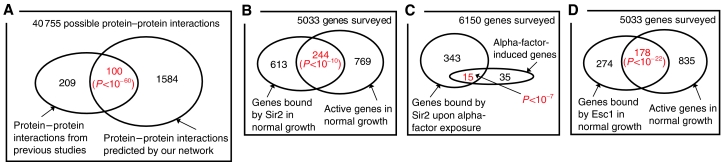
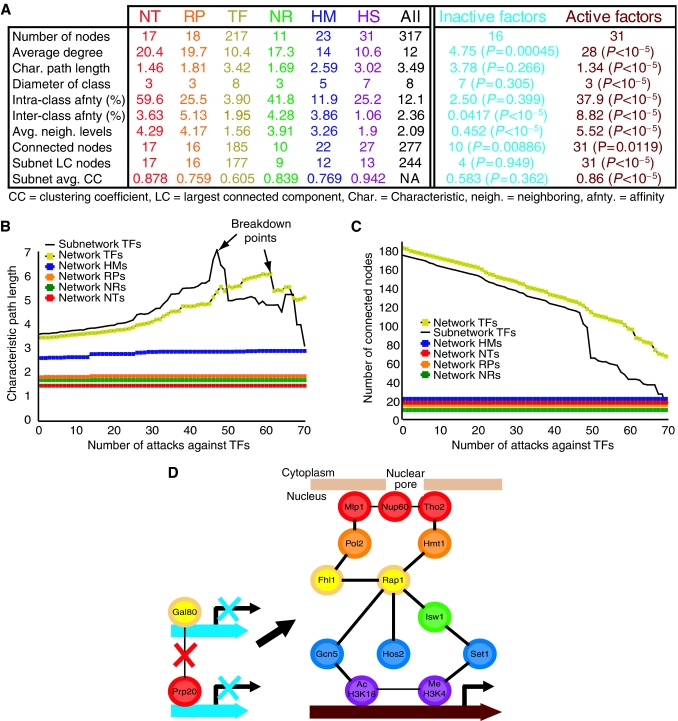
Regulation of eukaryotic gene expression depends on groups of related proteins acting at the levels of chromatin organization, transcriptional initiation, RNA processing, and nuclear transport. However, a unified understanding of how these different levels of transcriptional control interact has been lacking. Here, we combine genome-wide protein-DNA binding data from multiple sources to infer the connections between functional groups of regulators in Saccharomyces cerevisiae. Our resulting transcriptional network uncovers novel biological relationships; supporting experiments confirm new associations between actively transcribed genes and Sir2 and Esc1, two proteins normally linked to silencing chromatin. Analysis of the regulatory network also reveals an elegant architecture for transcriptional control. Using communication theory, we show that most protein regulators prefer to form modules within their functional class, whereas essential proteins maintain the sparse connections between different classes. Moreover, we provide evidence that communication between different regulatory groups improves the robustness and adaptivity of the cell.


Figures

Figure 1
Figure 1
Building a network. (A) Levels of the eukaryotic transcriptional architecture integrated in our analysis. (BD) TF X's and NR Y's genome-wide binding data are integrated, normalized, and traced through the network algorithm (see text).
Figure 2
Figure 2
Resulting network. (A) Each circle (node) represents a regulator from a color-coded group and each link (edge) represents a significant synergistic (positive) binding relationship between two factors (see Supplementary Figure 1 for opposing (negative) links). Each node is labeled by the regulator's common name followed by an ‘i' or ‘o' if its genomic occupancy was measured at intergenic or ORF regions, respectively. The dotted box shows factors that have a preference for binding active genes. (BG) Zoom in on several known interactions highlighted in solid boxes (see text). Network visualization was performed using Pajek (http://vlado.fmf.uni-lj.si/pub/networks/pajek/doc/pajekman.htm).
Figure 3
Figure 3
Network validation. (A) Protein–protein associations from previous studies overlap significantly with DNA-binding relationships predicted by the network. (B, C) Experiments support our network's prediction that Sir2 associates with actively transcribed genes in both (B) normal and (C) alpha-factor growth environments. (D) Esc1, another silencing protein, also associates with actively transcribed genes. See Supplementary Table 4 for a list of the gene sets in each Venn diagram.
Figure 4
Figure 4
Validation of novel Sir2- and Esc1-bound genes predicted by ChIP-chip experiments. (A) Venn diagram displaying the significant overlap of Sir2 binding sites between this study and the study by Lieb et al (2001). (B) A schematic representation of novel Sir2 and Esc1 targets with primer sets used in quantitative PCR. The transcriptional frequency of each gene is shown in mRNAs/hr (Holstege et al, 1998). (C, D) Quantitative PCR validation of Sir2 (C) and Esc1 (D) binding at actively transcribed genes. The binding enrichments are shown using bar graphs.
Figure 5
Figure 5
Network analysis. (A) Topology measures (first column, see text for definitions) for each color-coded level, active, and inactive regulators (first row). (B, C) Network robustness. Sequential attacks against TFs cause the characteristic path length to rise (B) as connectivity decreases (C) until the network reaches a breakdown point (peaks in panel B). TF attacks cause the connectivity of the TF subnetwork to disintegrate more rapidly than the overall transcriptional network, without affecting communication within other regulatory levels (flat lines). (D) Network adaptivity. In contrast to inactive genes, increased communication between regulators at active genes expedites the propagation of information (compare average neighboring levels and characteristic path length of last 2 columns in panel A) and may improve the speed and redundancy of the cell's response to dynamic environmental conditions. Our unified model connects several factors individually implicated in active gene expression (Lieb et al, 2001; Casolari et al, 2004; Robert et al, 2004).

References

    1. Albert R, Jeong H, Barabasi AL (2000) Error and attack tolerance of complex networks. Nature 406: 378–382 - PubMed
    1. Balaji S, Babu MM, Iyer LM, Luscombe NM, Aravind L (2006a) Comprehensive analysis of combinatorial regulation using the transcriptional regulatory network of yeast. J Mol Biol 360: 213–227 - PubMed
    1. Balaji S, Iyer LM, Aravind L, Babu MM (2006b) Uncovering a hidden distributed architecture behind scale-free transcriptional regulatory networks. J Mol Biol 360: 204–212 - PubMed
    1. Bar-Joseph Z, Gerber GK, Lee TI, Rinaldi NJ, Yoo JY, Robert F, Gordon DB, Fraenkel E, Jaakkola TS, Young RA, Gifford DK (2003) Computational discovery of gene modules and regulatory networks. Nat Biotechnol 21: 1337–1342 - PubMed
    1. Barabasi AL, Oltvai ZN (2004) Network biology: understanding the cell's functional organization. Nat Rev Genet 5: 101–113 - PubMed

Publication types

MeSH terms

LinkOut - more resources