

Widespread discordance of gene trees with species tree in Drosophila: evidence for incomplete lineage sorting
- PMID: 17132051
- PMCID: PMC1626107
- DOI: 10.1371/journal.pgen.0020173
Widespread discordance of gene trees with species tree in Drosophila: evidence for incomplete lineage sorting
Abstract
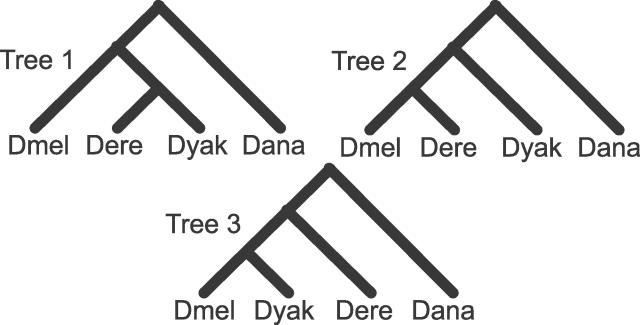
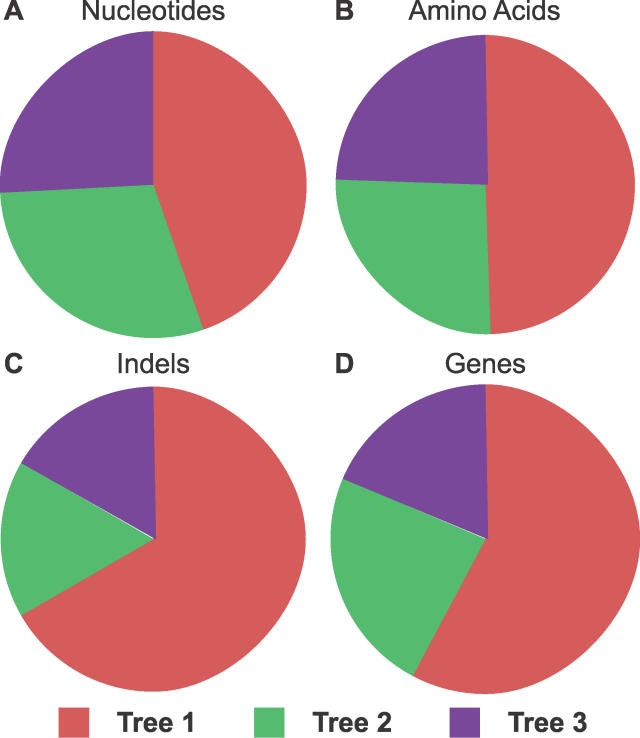
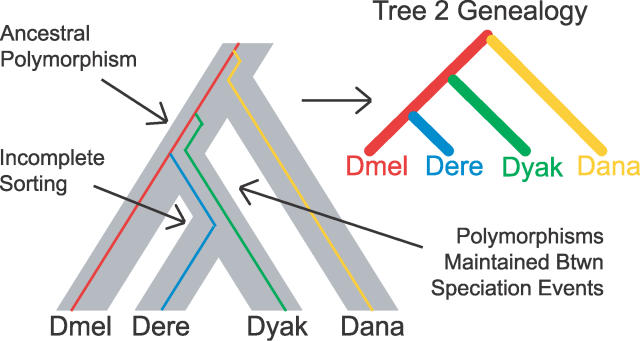
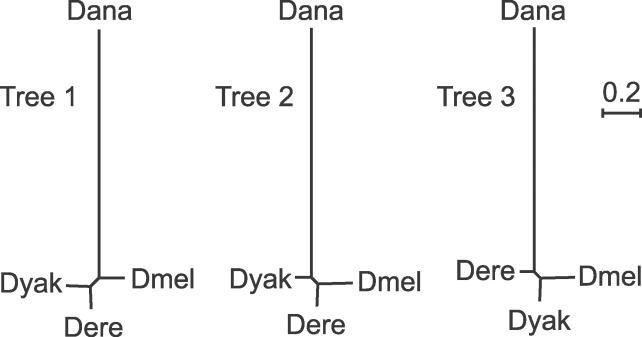
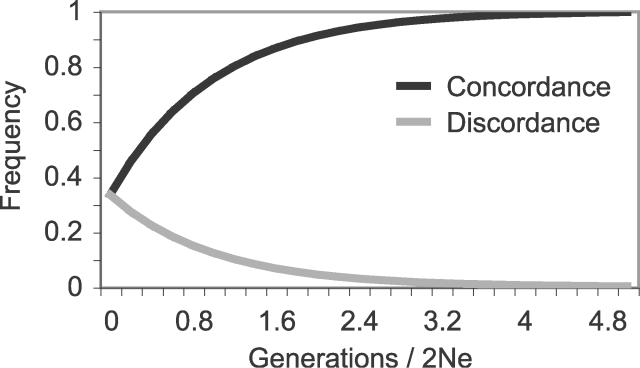
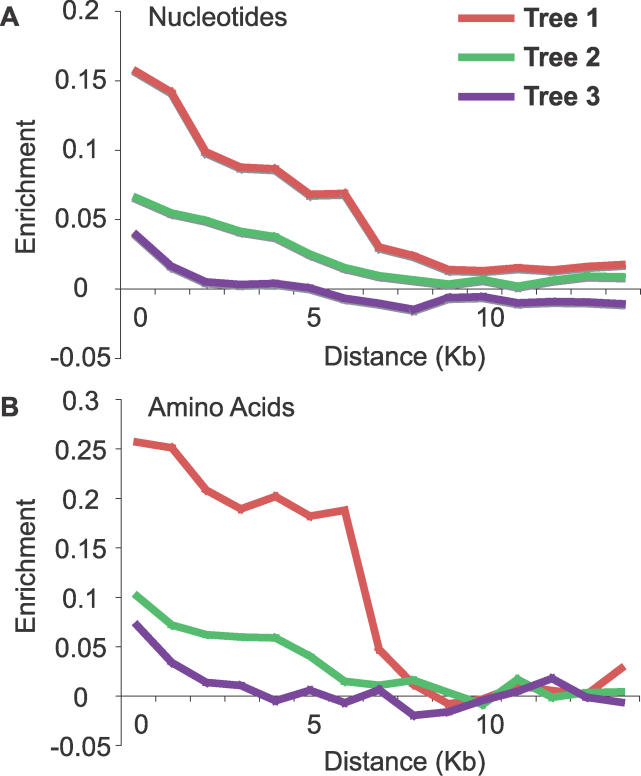
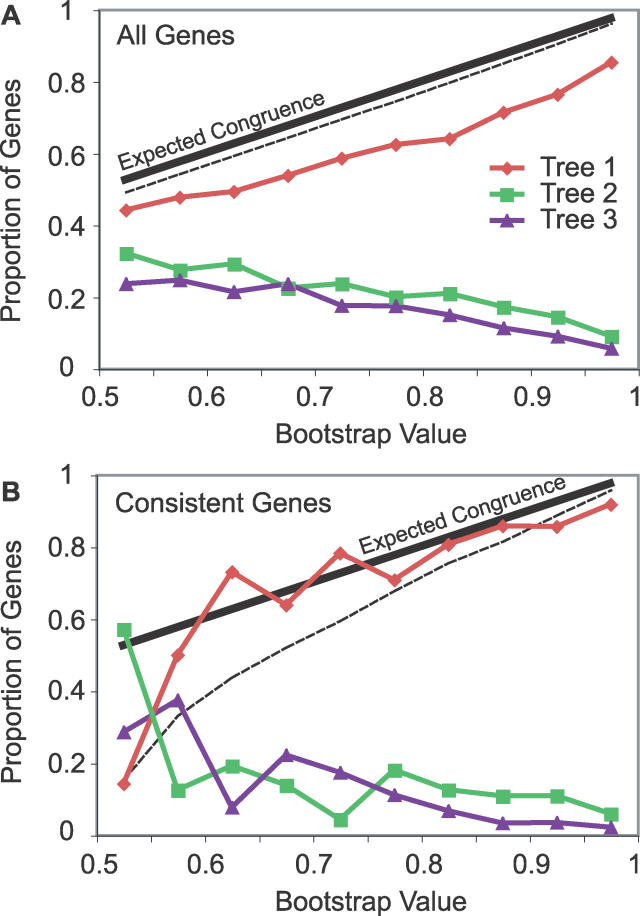
The phylogenetic relationship of the now fully sequenced species Drosophila erecta and D. yakuba with respect to the D. melanogaster species complex has been a subject of controversy. All three possible groupings of the species have been reported in the past, though recent multi-gene studies suggest that D. erecta and D. yakuba are sister species. Using the whole genomes of each of these species as well as the four other fully sequenced species in the subgenus Sophophora, we set out to investigate the placement of D. erecta and D. yakuba in the D. melanogaster species group and to understand the cause of the past incongruence. Though we find that the phylogeny grouping D. erecta and D. yakuba together is the best supported, we also find widespread incongruence in nucleotide and amino acid substitutions, insertions and deletions, and gene trees. The time inferred to span the two key speciation events is short enough that under the coalescent model, the incongruence could be the result of incomplete lineage sorting. Consistent with the lineage-sorting hypothesis, substitutions supporting the same tree were spatially clustered. Support for the different trees was found to be linked to recombination such that adjacent genes support the same tree most often in regions of low recombination and substitutions supporting the same tree are most enriched roughly on the same scale as linkage disequilibrium, also consistent with lineage sorting. The incongruence was found to be statistically significant and robust to model and species choice. No systematic biases were found. We conclude that phylogenetic incongruence in the D. melanogaster species complex is the result, at least in part, of incomplete lineage sorting. Incomplete lineage sorting will likely cause phylogenetic incongruence in many comparative genomics datasets. Methods to infer the correct species tree, the history of every base in the genome, and comparative methods that control for and/or utilize this information will be valuable advancements for the field of comparative genomics.
Conflict of interest statement
Competing interests. The authors have declared that no competing interests exist.
Figures
Similar articles
-
Phylogenetic incongruence in the Drosophila melanogaster species group.Mol Phylogenet Evol. 2007 Jun;43(3):1138-50. doi: 10.1016/j.ympev.2006.09.002. Epub 2006 Sep 9. Mol Phylogenet Evol. 2007. PMID: 17071113 Free PMC article.
-
Estimating species phylogeny from gene-tree probabilities despite incomplete lineage sorting: an example from Melanoplus grasshoppers.Syst Biol. 2007 Jun;56(3):400-11. doi: 10.1080/10635150701405560. Syst Biol. 2007. PMID: 17520504
-
Is homoplasy or lineage sorting the source of incongruent mtdna and nuclear gene trees in the stiff-tailed ducks (Nomonyx-Oxyura)?Syst Biol. 2005 Feb;54(1):35-55. doi: 10.1080/10635150590910249. Syst Biol. 2005. PMID: 15805009
-
Multilocus inference of species trees and DNA barcoding.Philos Trans R Soc Lond B Biol Sci. 2016 Sep 5;371(1702):20150335. doi: 10.1098/rstb.2015.0335. Philos Trans R Soc Lond B Biol Sci. 2016. PMID: 27481787 Free PMC article. Review.
-
Reticulate evolution: Detection and utility in the phylogenomics era.Mol Phylogenet Evol. 2024 Dec;201:108197. doi: 10.1016/j.ympev.2024.108197. Epub 2024 Sep 11. Mol Phylogenet Evol. 2024. PMID: 39270765 Review.
Cited by
-
Microallopatry caused strong diversification in Buthus scorpions (Scorpiones: Buthidae) in the Atlas Mountains (NW Africa).PLoS One. 2012;7(2):e29403. doi: 10.1371/journal.pone.0029403. Epub 2012 Feb 27. PLoS One. 2012. PMID: 22383951 Free PMC article.
-
Speciation genes are more likely to have discordant gene trees.Evol Lett. 2018 Aug 8;2(4):281-296. doi: 10.1002/evl3.77. eCollection 2018 Aug. Evol Lett. 2018. PMID: 30283682 Free PMC article.
-
Species tree inference by minimizing deep coalescences.PLoS Comput Biol. 2009 Sep;5(9):e1000501. doi: 10.1371/journal.pcbi.1000501. Epub 2009 Sep 11. PLoS Comput Biol. 2009. PMID: 19749978 Free PMC article.
-
Ecological and geographical speciation in Lucilia bufonivora: The evolution of amphibian obligate parasitism.Int J Parasitol Parasites Wildl. 2019 Sep 22;10:218-230. doi: 10.1016/j.ijppaw.2019.09.005. eCollection 2019 Dec. Int J Parasitol Parasites Wildl. 2019. PMID: 31667085 Free PMC article.
-
K-mer-Based Motif Analysis in Insect Species across Anopheles, Drosophila, and Glossina Genera and Its Application to Species Classification.Comput Math Methods Med. 2019 Nov 15;2019:4259479. doi: 10.1155/2019/4259479. eCollection 2019. Comput Math Methods Med. 2019. PMID: 31827584 Free PMC article.
References
-
- Russo CA, Takezaki N, Nei M. Molecular phylogeny and divergence times of drosophilid species. Mol Biol Evol. 1995;12:391–404. - PubMed
-
- Powell JR. Progress and prospects in evolutionary biology: The Drosophila model. New York: Oxford University Press; 1997. 562
-
- Lewis RL, Beckenbach AT, Mooers AO. The phylogeny of the subgroups within the melanogaster species group: Likelihood tests on COI and COII sequences and a Bayesian estimate of phylogeny. Mol Phylogenet Evol. 2005;37:15–24. - PubMed
-
- O'Grady PM, Kidwell MG. Phylogeny of the subgenus sophophora (Diptera: drosophilidae) based on combined analysis of nuclear and mitochondrial sequences. Mol Phylogenet Evol. 2002;22:442–453. - PubMed
-
- Remsen J, O'Grady P. Phylogeny of Drosophilinae (Diptera: Drosophilidae), with comments on combined analysis and character support. Mol Phylogenet Evol. 2002;24:249–264. - PubMed
Publication types
MeSH terms
Grants and funding
LinkOut - more resources
Full Text Sources
Other Literature Sources
Molecular Biology Databases
Miscellaneous
