

Review
doi: 10.1016/S0076-6879(06)17020-2.
Helicobacter pylori adhesion to carbohydrates
Affiliations
- PMID: 17132512
- PMCID: PMC2576508
- DOI: 10.1016/S0076-6879(06)17020-2
Item in Clipboard
Review
Helicobacter pylori adhesion to carbohydrates
Methods Enzymol.
2006.
Abstract
Adherence of bacterial pathogens to host tissues contributes to colonization and virulence and typically involves specific interactions between bacterial proteins called adhesins and cognate oligosaccharide (glycan) or protein motifs in the host that are used as receptors. A given pathogen may have multiple adhesins, each specific for a different set of receptors and, potentially, with different roles in infection and disease. This chapter provides strategies for identifying and analyzing host glycan receptors and the bacterial adhesins that exploit them as receptors, with particular reference to adherence of the gastric pathogen Helicobacter pylori.
Figures
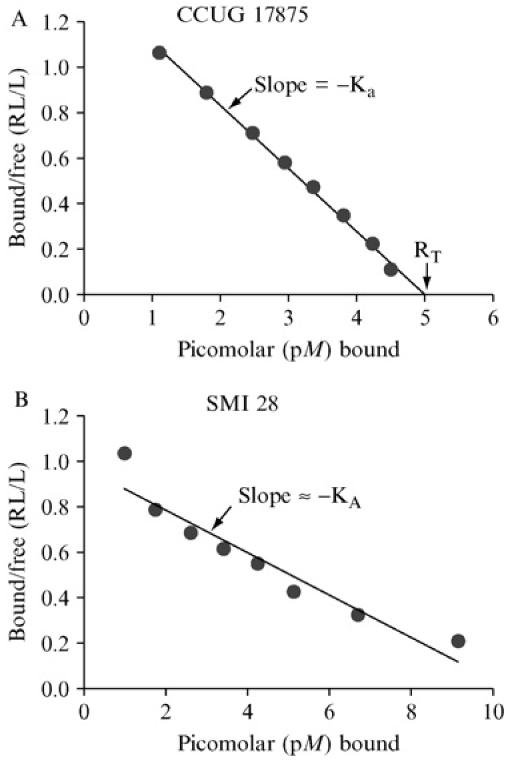
1. Affinity analyses according to Scatchard, essentially as described previously (Rosenthal, 1967; Scatchard, 1949). The equilibrium of glycoconjugate bound to bacterial cells versus conjugate free in solution (bound/free, i.e. pellet/supernatant) is depicted on the Y-axis, whereas total glycoconjugate bound is depicted on the X-axis. The maximal Y-axis value is achieved with only low levels of conjugate. The negative value of the slope derived by linear regression provides fairly good estimation of average KA. Thus, in such a Scatchard plot, the slope of the straight line is −Ka (i.e., the affinity constant). For bacterial strains with strong binding properties, high (saturating) levels of glycoconjugate make the line graph cross the X-axis and, by so doing, provides information about the total binding capacity of the glycoconjugate tested (RT). Thus, RT also tells us about the number of cognate adhesins per bacterial cell. (A) The affinity analysis is illustrated by H. pylori strain CCUG 17875 that produce an almost ideal linear slope, with an affinity (Ka)of 2.7 × 10¹¹ M−1, whereas the H. pylori clinical isolate SMI 28 demonstrates a curved slope, with steeper slope and thus higher Ka during limiting conditions, followed by a more relaxed slope when the receptor glycoconjugate is added in excess (B). This gradual shift in Ka likely reflects heterogeneities in the adhesin complexes alternatively a mix of adhesin activities (proteins) that differ in binding properties and affinities for the receptor. Please note that in a curved slope, the total binding capacity of glycoconjugate (RT) cannot be deduced from the point where the line graph (eventually) crosses the X-axis but needs to be estimated by approximation (on the basis of the slope in the first part of the graph). Alternately, the total binding capacity can be functionally deduced by performing the RIA binding assay with receptor conjugate added in excess (i.e., RIA during saturating conditions). Fortunately, most BabA adhesins demonstrate high-affinity binding properties that allow for estimations of full binding capacity for interpretation of the corresponding numbers of bacterial adhesin molecules.
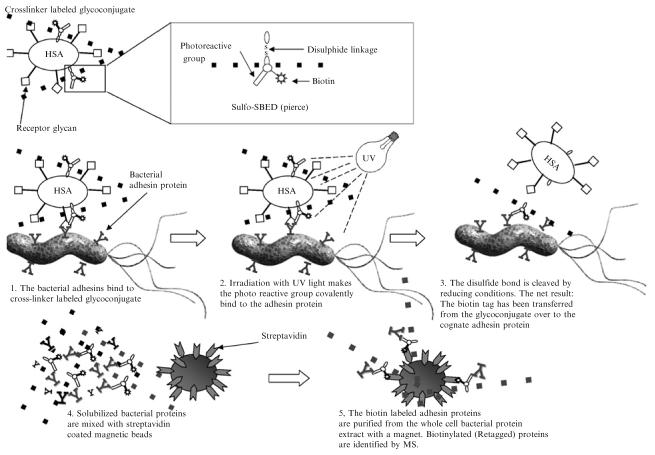
Retagging and adhesin purification, essentially as described (Ilver et al., 1998; Mahdavi et al., 2002). The multifunctional Sulfo-SBED cross-linker is chemically attached to the protein core of the cognate receptor glycoconjugate by the NHS group. The cross-linker– labeled glycoconjugate is next mixed with H. pylori and the bacterial adhesin proteins bind the glycoconjugate (left panel). The bacterial cells with bound cross-linker–tagged glycoconjugate are subjected to UV irradiation (mid panel), and the photoreactive azide group forms a covalent bond to structures in the immediate surrounding area (usually the adhesin protein). By addition of reducing conditions, the disulfide bond located in the cross-linker structure is cleaved, and the freed glycoconjugate can then usually be washed away (right panel). The retagged bacterial cells are fully solubilized with a harsh detergent to extract the adhesins, and retagged adhesin proteins are purified by adsorption to streptavidin-coated magnetic beads. The isolated adhesin protein is next subjected to MS analyses and identified by its unique peptide composition.
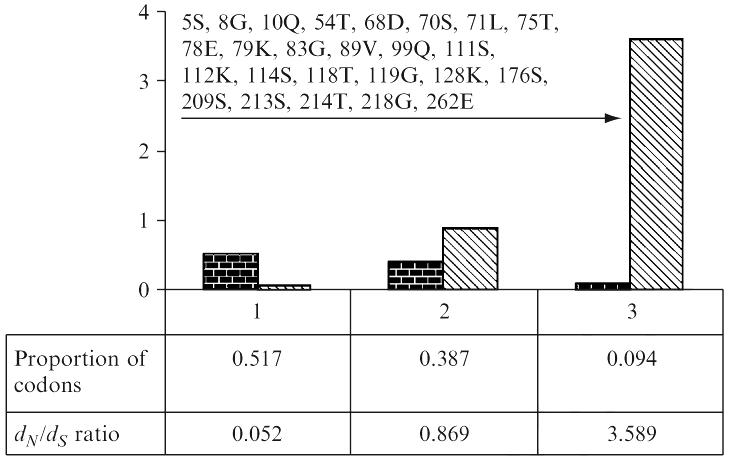
Histogram showing the frequency distribution of three codon classes and their associated dN/dS ratios computed under the M3 model. Arrow indicates positively selected codons. Codons identified to be under positive selection are shown. Alignment used this for analysis is available from GenBank [gi:49473301].
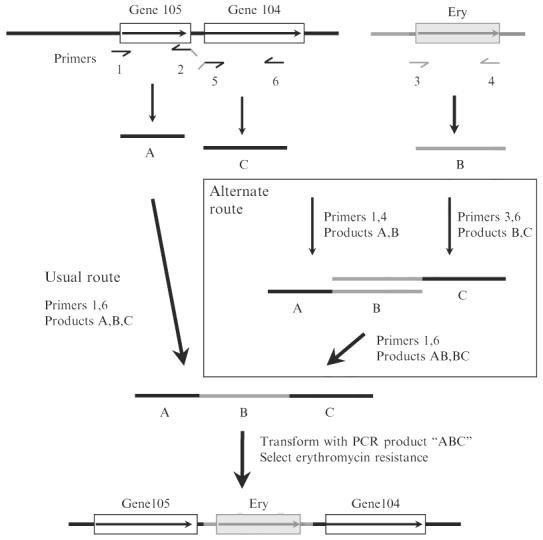
Construction of insertion deletion allele marked with a resistance determinant by PCR without need for recombinant DNA cloning, essentially as described (Chalker et al., 2001). In general, such constructions entail amplification of DNA segments to left and right of the intended site of insertion/deletion (products A and C, with primers 1 and 2 and with primers 5 and 6, respectively), and also a selectable resistance determinant (here resistance to erythromycin; designated fragment B with primers 3 and 4). The 5′ ends of primers 2 and 5 (denoted as downward slanted lines) are complementary to the primers used for amplification of the resistance determinant (fragment B). After mixing of separately amplified fragments A, B, and C, amplification with primers 1 and 6 generally results in an assembled PCR product containing the desired insertion/deletion allele as diagrammed at bottom, on the basis of “crossover PCR” at sites of overlap because of complementarity of 5′ ends of primers 2 and 3 and of primers 4 and 5. In some cases this simple three-fragment assembly fails as illustrated in Fig. 5 (gel lane marked ?? at bottom). In such cases, an alternate strategy (boxed) that entails separate two fragment assemblies of A and B, and of B and C, and then a final assembly of subassembly AB and BC often gives the desired product (rightmost experimental lane marked ABC at bottom). Gene105 and gene104 are arbitrary designations for orfs in the H. pylori genome. For detailed design of primer sequences for use with erythromycin and other resistance markers, see Tan and Berg (2004) and Tan et al. (2005).
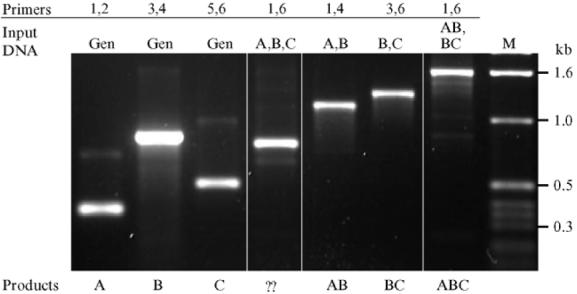
Agarose gel electrophoresis of products from construction of insertion/deletion allele diagrammed in Fig. 4. Primers 1 through 6 and simple PCR products A, B, C, and assembled products AB, BC, and ABC all correspond to those diagrammed in Fig. 4. Input DNA “gen” indicates genomic DNA. The product designated ?? is a PCR-generated deletion variant of the desired ABC assembly that came to predominate in the PCR product population because of its smaller size and, thus, replication advantage. It has not been characterized further. M indicates marker DNA, with sizes of characteristic fragments indicated at right.
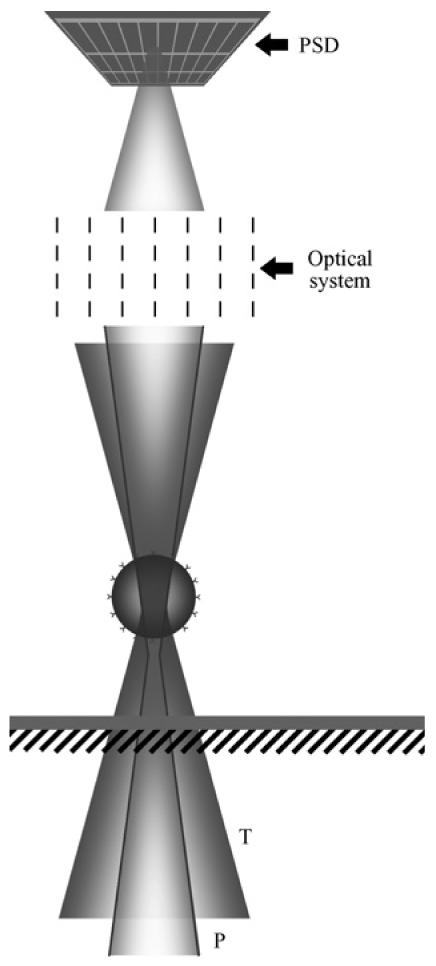
Position detection of a bead confined in the optical trap. T, trapping laser beam (Ti-sapphire); P, probe laser beam (HeNe); PSD, position sensitive detector.
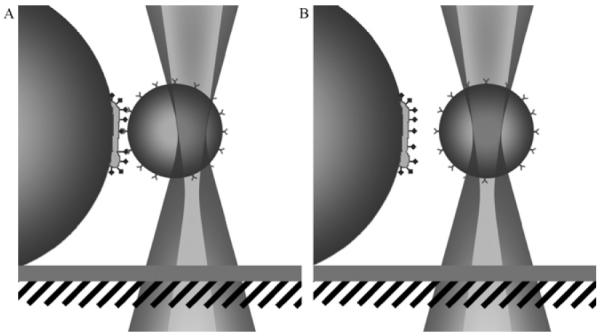
Illustration of the measurement procedure. (A) The large bead with the bacterium pulls the small Leb-coated bead away from the center of the optical trap. (B) The force in the system increases until the binding breaks, whereby the Leb bead returns to the center.
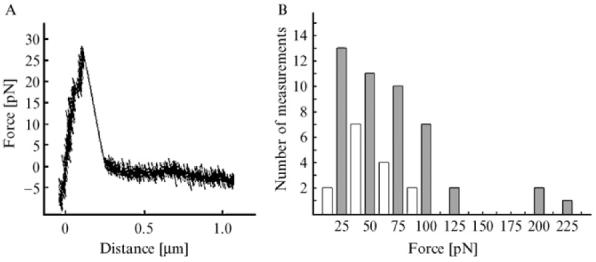
(A) Typical force-versus-distance graph from a measurement on a single bacterium of the 17875Leb strain. The force increases linearly force until the binding breaks. (B) Histogram of the distribution of rupture forces from in total 61 measurements on the 17875Leb strain. The intervals are centered at multiples of 12.5 pN with a width of ±6.25 pN. Most of the rupture forces appear in the even intervals (marked with filled bars). This suggests the existence of an elemental force in the system of ∼25 pN, which is interpreted as the rupture force of a single BabA-Leb binding.
References
-
- Ashkin A, Schutze K, Dziedzic JM, Euteneuer U, Schliwa M. Force generation of organelle transport measured in vivo by an infrared laser trap. Nature. 1990;348:346–348. - PubMed
-
- Aspholm-Hurtig M, Dailide G, Lahmann M, Kalia A, Ilver D, Roche N, Vikström S, Sjöström R, Linden S, Bäckström A, Lundberg C, Arnqvist A, Mahdavi J, Nilsson UJ, Velapatino B, Gilman RH, Gerhard M, Alarcon T, Lopez-Brea M, Nakazawa T, Fox JG, Correa P, Dominguez-Bello MG, Perez-Perez GI, Blaser MJ, Normark S, Carlstedt I, Oscarson S, Teneberg S, Berg DE, Borén T. Functional adaptation of BabA, the H. pylori ABO blood group antigen binding adhesin. Science. 2004;305:519–522. - PubMed
-
- Björnham O, Fällman E, Axner O, Nilsson U, Borén T, Schedin S. Measurements of the binding force between the Helicobacter pylori adhesin BabA and the Lewis b blood group antigen using optical tweezers. J. Biomedical Optics. 2005;10:044024–0444024-9. - PubMed
Publication types
MeSH terms
Grants and funding
LinkOut - more resources
Full Text Sources
Other Literature Sources
