. 2006 Dec 5;103(49):18799-804.
doi: 10.1073/pnas.0609225103. Epub 2006 Nov 28.

Dendritic spines linearize the summation of excitatory potentials

Affiliations

Dendritic spines linearize the summation of excitatory potentials

Roberto Araya et al. Proc Natl Acad Sci U S A. .

Abstract

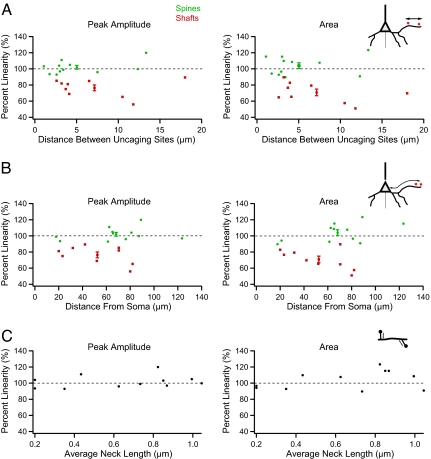
In mammalian cortex, most excitatory inputs occur on dendritic spines, avoiding dendritic shafts. Although spines biochemically isolate inputs, nonspiny neurons can also implement biochemical compartmentalization; so, it is possible that spines have an additional function. We have recently shown that the spine neck can filter membrane potentials going into and out of the spine. To investigate the potential function of this electrical filtering, we used two-photon uncaging of glutamate and compared the integration of electrical signals in spines vs. dendritic shafts from basal dendrites of mouse layer 5 pyramidal neurons. Uncaging potentials onto spines summed linearly, whereas potentials on dendritic shafts reduced each other's effect. Linear integration of spines was maintained regardless of the amplitude of the response, distance between spines (as close as < 2 microm), distance of the spines to the soma, dendritic diameter, or spine neck length. Our findings indicate that spines serve as electrical isolators to prevent input interaction, and thus generate a linear arithmetic of excitatory inputs. Linear integration could be an essential feature of cortical and other spine-laden circuits.


Conflict of interest statement

The authors declare no conflict of interest.

Figures

Fig. 1.
Fig. 1.
Summation of uncaging potentials on spines and dendritic shafts. (A) (Left) Layer 5 pyramidal cell filled with Alexa Fluor 488. (Scale bar: 50 μm.) (Right) Representative basal dendrite selected for uncaging. (Scale bar: 5 μm.) (B) Protocol for testing summation. Red dots indicate the site of uncaging in spines or shaft locations. Uncaging was performed first at each spine or shaft location (1 or 2) and then in either both spines together or in both shaft locations (1 + 2). (C) (Upper) Summation in spines. (Left) Individual examples. (Right) Averages. Red traces correspond to an average of 10 depolarizations (orange traces) caused by uncaging over each of the two spines, and black traces correspond to the expected algebraic (linear) sum of the individual events of each spine. Note how the average response is close to expected. (Scale bar: 1 μm/2 mV/50 ms.) (Lower) Summation in shafts. Data are presented as in B. Note the sublinear summation. (Scale bars: 1 μm/1 mV/50 ms.)
Fig. 2.
Fig. 2.
Input summation is linear in spines and sublinear in shafts. Dependency of summation on uncaging potential strengths. (A and B) Plot of the actual vs. the expected peak amplitudes (A) and actual vs. the expected areas (B) from uncaging events in spines (green) or shafts (red) on basal dendrite of layer 5 pyramidal cell. Inputs onto spines sum linearly at small and large amplitudes, but inputs onto dendritic shafts sum sublinearly. The dotted line shows expected linear summation, and the solid lines are linear regression fits to the uncaging data (P < 0.005, Mann–Whitney comparing spines vs. shafts). (C) Summary of results. Linearity is expressed as the ratio of the peak amplitude or area of the combined event to the expected values, calculated by adding the two separate events. Data are presented as averages ± SEM.
Fig. 3.
Fig. 3.
Spine linearity is not affected by interspine distance, distance to the soma, or neck length. Summation of uncaging potentials is not affected by the distance between uncaging stimuli (A), distance of those inputs from the soma (B), or the average neck length (C). Color circles represent the mean ± SEM percentage linearity of the experiments from each condition, positioned at average x axis value.

References

    1. Ramón y, Cajal S. Rev Trimest Histol Norm Patterns. 1888;1:1–10.
    1. Shepherd G. J Neurophysiol. 1996;75:2197–2210. - PubMed
    1. Yuste R, Denk W. Nature. 1995;375:682–684. - PubMed
    1. Svoboda K, Tank DW, Denk W. Science. 1996;272:716–719. - PubMed
    1. Majewska A, Tashiro A, Yuste R. J Neurosci. 2000;20:8262–8268. - PMC - PubMed

Publication types

LinkOut - more resources