Review
. 2006 Oct:1080:395-414.
doi: 10.1196/annals.1380.029.

Modeling cardiac ischemia

Affiliations
Review

Modeling cardiac ischemia

Blanca Rodríguez et al. Ann N Y Acad Sci. 2006 Oct.

Abstract

Myocardial ischemia is one of the main causes of sudden cardiac death, with 80% of victims suffering from coronary heart disease. In acute myocardial ischemia, the obstruction of coronary flow leads to the interruption of oxygen flow, glucose, and washout in the affected tissue. Cellular metabolism is impaired and severe electrophysiological changes in ionic currents and concentrations ensue, which favor the development of lethal cardiac arrhythmias such as ventricular fibrillation. Due to the burden imposed by ischemia in our societies, a large body of research has attempted to unravel the mechanisms of initiation, sustenance, and termination of cardiac arrhythmias in acute ischemia, but the rapidity and complexity of ischemia-induced changes as well as the limitations in current experimental techniques have hampered evaluation of ischemia-induced alterations in cardiac electrical activity and understanding of the underlying mechanisms. Over the last decade, computer simulations have demonstrated the ability to provide insight, with high spatiotemporal resolution, into ischemic abnormalities in cardiac electrophysiological behavior from the ionic channel to the whole organ. This article aims to review and summarize the results of these studies and to emphasize the role of computer simulations in improving the understanding of ischemia-related arrhythmias and how to efficiently terminate them.


Figures

FIGURE 1
FIGURE 1
Time courses of the extracellular K+ concentration ([K+]o) during 14 min of ischemia obtained for different ischemic mechanisms. Traces I–III represent individual effects on [K+]o of: change in ATP-sensitive K+ current (I K(ATP)); current through the Na+/K+ pump (I NaK); and inclusion of ischemia-activated Na+ inward current (I NaS), respectively. Trace “I + II + III” is the sum of traces I–III. Traces IV–VI correspond to the combined effect of the two mechanisms indicated next to each trace. Trace VII depicts the simultaneous effect of the three mechanisms on [K+]o. In all cases, when I K(ATP) was activated, the final value of the fraction of activated ATP-sensitive K+ (KATP) channels was 0.8%. When I NaS was activated, the final value of I NaS was 1.2 μA/μF, and when an inhibition of the maximum current through the Na+/K+ pump was considered, the final value of the degree of inhibition of the Na+/K+ was 35%. (Modified from reference .)
FIGURE 2
FIGURE 2
Evolution of the action potential during 12 min of simulated ischemia.
FIGURE 3
FIGURE 3
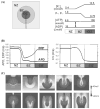
Arrhythmogenesis in regional ischemia. Panel A: Schematic of the 2D model of regionally ischemic tissue (left) and the spatial variations in extracellular potassium concentration ([K+]o), intracellular ATP and ADP concentrations ([ATP]i and [ADP]i), and the degree of inhibition of the maximum conductances of the Na+ and Ca2+ currents in the central ischemic zone (CIZ), border zone (BZ), and normal zone (NZ) (right). Panel B: Spatial variation in the effective refractory period and action potential duration (left) and in the longitudinal conduction velocity (right) along the dashed line depicted in panel A, left. Panel C: Snapshots of transmembrane potential distribution at different instants of time following the delivery of a premature stimulus at CI = 210 msec in the lower part of the 2D sheet illustrated in panel A. Snapshots are separated by 50 msec; the first corresponds to 50 msec after the delivery of the premature stimulus. Panel C is shown in color online. (Modified from reference .)
FIGURE 4
FIGURE 4
Contribution of transmural heterogeneities to arrhythmogenesis in regional ischemia. Panel A: 2D anatomically accurate rabbit ventricular model of regional ischemia following LAD occlusion. CIZ is central ischemia zone, NZ–normal zone, EBZ–endo and epicardial border zone, and LBZ–lateral border zone. Panel B: Activation time map of a reentrant beat following a premature stimulus (top) and time course of transmembrane potential in the node marked by the arrow (bottom). (Modified from reference.)
FIGURE 5
FIGURE 5
Anterior transmembrane potential distribution in normoxia and global ischemia for a 6.4 V/cm shock applied at CI = 160 msec. Times refer to shock end. Color scale is saturated, that is, potentials above +20 mV and below −90 mV appear red and blue, respectively. Diagrams present major features of postshock behavior. Dotted lines indicate spatial extent of wavefronts at shock end. Solid arrows show direction of propagation. Dashed arrows depict direction of decremental conduction. Thick dashed lines mark locations at which conduction becomes decremental. The Figure is shown in color online. (Modified from reference .)

References

    1. Zipes DP, Wellens HJJ. Sudden cardiac death. Circulation. 1998;98:2334–2351. - PubMed
    1. Rubart M, Zipes DP. Mechanisms of sudden cardiac death. J Clin Invest. 2005;115:2305–2315. - PMC - PubMed
    1. Carmeliet E. Cardiac ionic currents and acute ischemia: from channels to arrhythmias. Physiol Rev. 1999;79:917–1017. - PubMed
    1. Harris AS, Bisteni A, Russell RA, et al. Excitatory factors in ventricular tachycardia resulting from myocardial ischemia. Potassium a major excitant. Science. 1954;119:200–203. - PubMed
    1. Wit AL, Janse MJ. Experimental models of ventricular tachycardia and fibrillation caused by ischemia and infarction. Circulation. 1992;85(Suppl I):I32–I42. - PubMed

Publication types