. 2006;7(11):R112.
doi: 10.1186/gb-2006-7-11-r112.

Recurrent insertion and duplication generate networks of transposable element sequences in the Drosophila melanogaster genome

Affiliations

Recurrent insertion and duplication generate networks of transposable element sequences in the Drosophila melanogaster genome

Casey M Bergman et al. Genome Biol. 2006.

Abstract

Background: The recent availability of genome sequences has provided unparalleled insights into the broad-scale patterns of transposable element (TE) sequences in eukaryotic genomes. Nevertheless, the difficulties that TEs pose for genome assembly and annotation have prevented detailed, quantitative inferences about the contribution of TEs to genomes sequences.

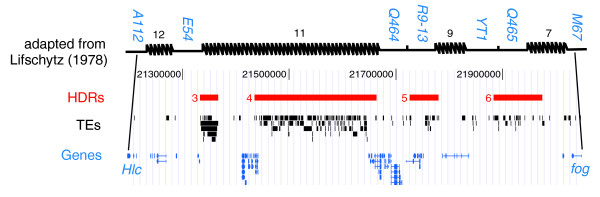
Results: Using a high-resolution annotation of TEs in Release 4 genome sequence, we revise estimates of TE abundance in Drosophila melanogaster. We show that TEs are non-randomly distributed within regions of high and low TE abundance, and that pericentromeric regions with high TE abundance are mosaics of distinct regions of extreme and normal TE density. Comparative analysis revealed that this punctate pattern evolves jointly by transposition and duplication, but not by inversion of TE-rich regions from unsequenced heterochromatin. Analysis of genome-wide patterns of TE nesting revealed a 'nesting network' that includes virtually all of the known TE families in the genome. Numerous directed cycles exist among TE families in the nesting network, implying concurrent or overlapping periods of transpositional activity.

Conclusion: Rapid restructuring of the genomic landscape by transposition and duplication has recently added hundreds of kilobases of TE sequence to pericentromeric regions in D. melanogaster. These events create ragged transitions between unique and repetitive sequences in the zone between euchromatic and beta-heterochromatic regions. Complex relationships of TE nesting in beta-heterochromatic regions raise the possibility of a co-suppression network that may act as a global surveillance system against the majority of TE families in D. melanogaster.


Figures

Figure 1
Figure 1
Distribution of TEs along the D. melanogaster Release 4 chromosome arms. Numbers of TEs per 50 Kb window are plotted as a function of position along a chromosome arm. Abundance for all families excluding the INE-1 is shown in black for the main and inset panels, and in blue for the INE-1 family in inset panels. Positions of the cytologically estimated boundaries between euchromatin and heterochromatin in pericentromeric regions are shown as red triangles. Positions of genetically estimated boundaries between high and reduced recombination, and between reduced and null recombination, in pericentromeric regions are shown as green and orange triangles respectively. Filled circles indicate centromeric regions that are currently not included in the Release 4 genome sequence. HDRs on the major chromosome arms are numbered in purple.
Figure 2
Figure 2
Example regions of extreme TE density. (a) Structure of HDR16 in the Hsp70B region showing tandem arrays of an invader1→DM88 nest interrupted by 1360 and micropia insertions and flanked by S-element insertions. Duplicate Hsp70 genes are shown at the bottom of the panel along with the non-coding RNA αγ-element. (b) Structure of HDR1 showing tandem arrays of clustered jockey+Rt1c and Stalker4+invader3 elements interrupted by invader2, F-element and mdg3 insertions. This region also generates eight CG32821-like gene duplicates. Note that colors for TE families differ in (a,b).
Figure 3
Figure 3
Comparative sequence analysis of two regions of extreme TE density. (a,b) Pairwise comparison of D. melanogaster HDRs with the orthologous segments from the D. yakuba genome. (c,d) Self-comparison of D. melanogaster HDRs. Note that the flanking sequences between species are collinear (a,b) and the presence of complex duplicated sequences (c,d).
Figure 4
Figure 4
Global nesting graph at the level of individual TEs. Nesting relationships among TEs are depicted as a directed, acyclic graph. Nodes (blue circles) represent individual TEs and directed edges (green arrows) represent transposition events that create primary nesting relationships, with complex nesting events represented as connected components of the graph. The majority of nests in the genome are characterized by one or more primary nesting relationships, while some larger nests are composed of secondary or tertiary nesting relationships. The largest nest (*) currently annotated in the genome is found on chromosome 2R at coordinates 1,763,561-1,829,561. The second largest nest (**) currently annotated in the genome has been described in detail previously by Maside et al. [34] and is found on chromosome X at coordinates 21,366,773-21,333,853.
Figure 5
Figure 5
Global nesting graph at the level of TE families. Nodes (blue circles) represent TE families and directed edges (green arrows) represent observed instances of primary nesting relationships. Redundant edges that arise from the different instances in the genome of the same primary nesting event are not shown. Essentially all families of TEs form a single connected component. Note that cycles within and between families at the family level are formed from nests of individuals from different genomic locations.
Figure 6
Figure 6
Directed cycles in the family-level TE nesting graph. Shown are the set of edge-disjoint directed cycles of path length greater than three. Nodes (blue circles) represent TE families and directed edges (green arrows) represent observed instances of primary nesting relationships. Note that many thousands of distinct directed cycles that share edges in common can be enumerated in the family-level nesting graph in addition to those shown here.
Figure 7
Figure 7
HDRs are hotspots for X-ray induced deletion. Alignment of the genetic map adapted from Figure 1 of Lifschytz [69] and the Release 4 genome annotation in the interval from Hlc (= A112) to fog (= M67) shows a one-to-one correspondence between HDRs 3, 4, 5 and 6 with X-ray hotspot intervals 12, 11, 9 and 7, respectively. Additional HDRs and X-ray hotspots discussed in the text are omitted for clarity.
Figure 8
Figure 8
Examples of potentially transposed TE nests. Four copies of related jockey2→Cr1a nests in HDR7 at the base of the X chromosome, with the two proximal copies nested within 297-elements. We note that a large number of additional TEs in this region are omitted for clarity. Simple tandem duplication of jockey2→Cr1a nests cannot explain nesting in the 297-element, and duplication of a jockey2→Cr1a→297 nest would require two subsequent complete losses of 297 sequences from the distal copies. An equally or more parsimonious explanation involves transposition of a jockey2→Cr1a nest into a 297-element and subsequent duplication.

References

    1. The Arabidopsis Genome Initiative Analysis of the genome sequence of the flowering plant Arabidopsis thaliana. Nature. 2000;408:796–815. doi: 10.1038/35048692. - DOI - PubMed
    1. Kaminker JS, Bergman CM, Kronmiller B, Carlson J, Svirskas R, Patel S, Frise E, Wheeler DA, Lewis SE, Rubin GM, et al. The transposable elements of the Drosophila melanogaster euchromatin: a genomics perspective. Genome Biol. 2002;3:RESEARCH0084. doi: 10.1186/gb-2002-3-12-research0084. - DOI - PMC - PubMed
    1. Lander ES, Linton LM, Birren B, Nusbaum C, Zody MC, Baldwin J, Devon K, Dewar K, Doyle M, FitzHugh W, et al. Initial sequencing and analysis of the human genome. Nature. 2001;409:860–921. doi: 10.1038/35057062. - DOI - PubMed
    1. Yu J, Hu S, Wang J, Wong GK, Li S, Liu B, Deng Y, Dai L, Zhou Y, Zhang X, et al. A draft sequence of the rice genome (Oryza sativa L. ssp. indica). Science. 2002;296:79–92. doi: 10.1126/science.1068037. - DOI - PubMed
    1. Myers EW, Sutton GG, Delcher AL, Dew IM, Fasulo DP, Flanigan MJ, Kravitz SA, Mobarry CM, Reinert KH, Remington KA, et al. A whole-genome assembly of Drosophila. Science. 2000;287:2196–2204. doi: 10.1126/science.287.5461.2196. - DOI - PubMed

Publication types

Substances

LinkOut - more resources