

The pendulum test as a tool to evaluate passive knee stiffness and viscosity of patients with rheumatoid arthritis
- PMID: 17134492
- PMCID: PMC1693559
- DOI: 10.1186/1471-2474-7-89
The pendulum test as a tool to evaluate passive knee stiffness and viscosity of patients with rheumatoid arthritis
Abstract
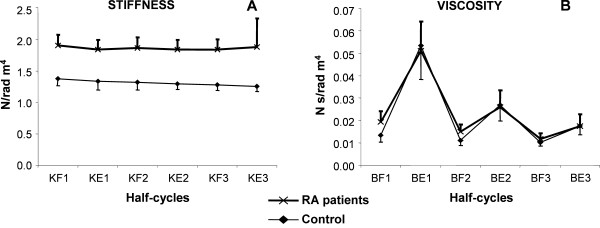
Background: The pendulum test of Wartenberg is a technique commonly used to measure passive knee motion with the aim to assess spasticity. We used this test to evaluate changes of the knee angular displacement, passive stiffness and viscosity in rheumatoid arthritis patients. Stiffness and viscosity represent passive resistances to joint motion associated with the structural properties of the joint tissue and of the muscular-tendon complex. Stiffness can be considered an intrinsic property of the tissues to resist deformation, while viscosity is related to cohesive forces between adjacent layers of tissues. Both parameters may influence the joint range of motion affecting angular displacement.
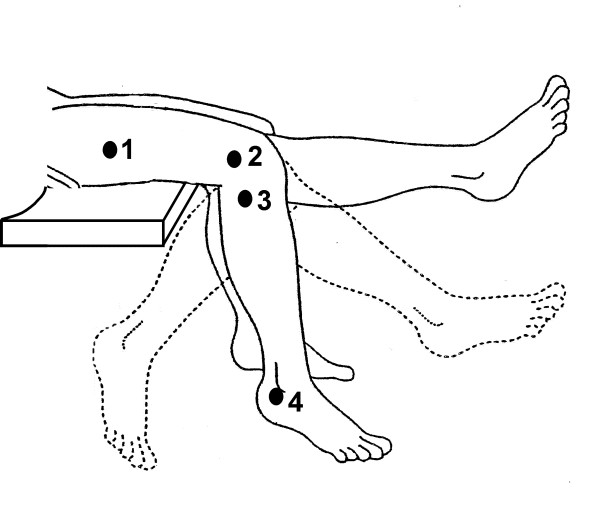
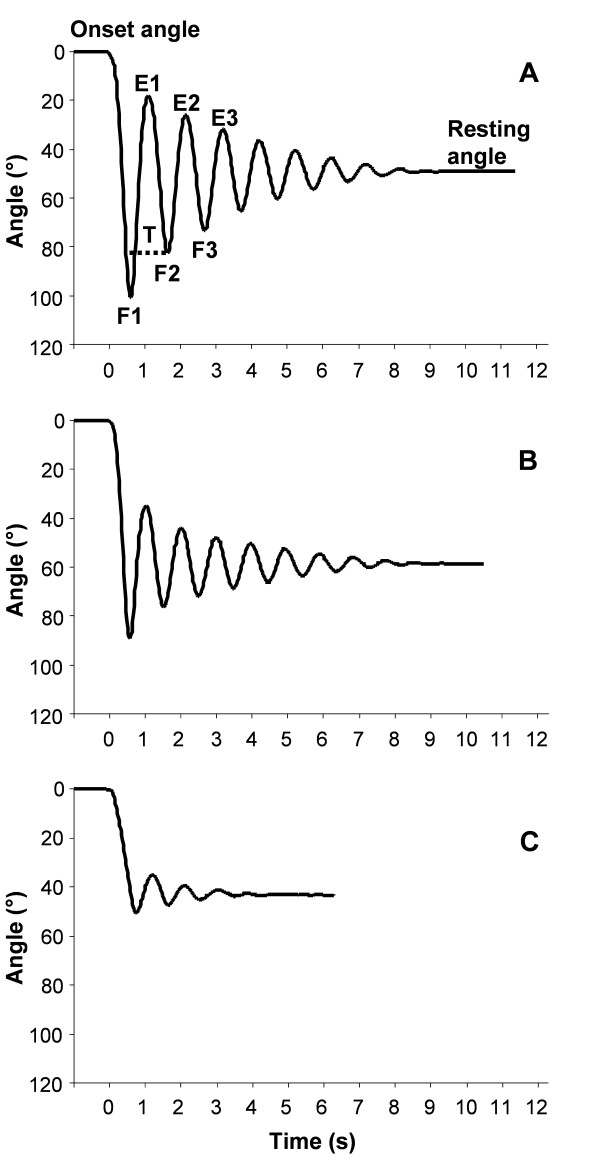
Methods: Nine women with rheumatoid arthritis were compared with a group of healthy women. With the subject half-lying, the relaxed knee was dropped from near-full extension and the characteristics of the ensuring damped unsustained knee oscillation evaluated. The kinematics of leg oscillations was recorded using ultrasonic markers (Zebris CMS HS 10) and the kinetic data were calculated from kinematic and anthropometric measures.
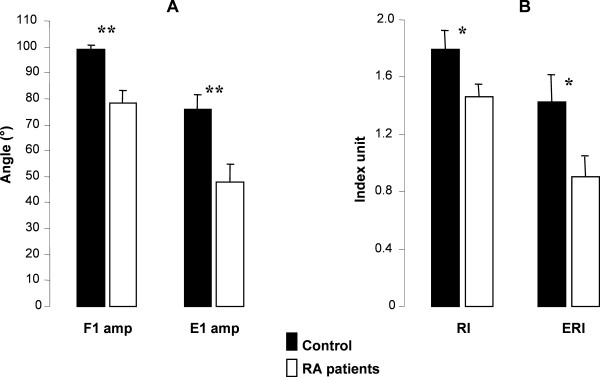
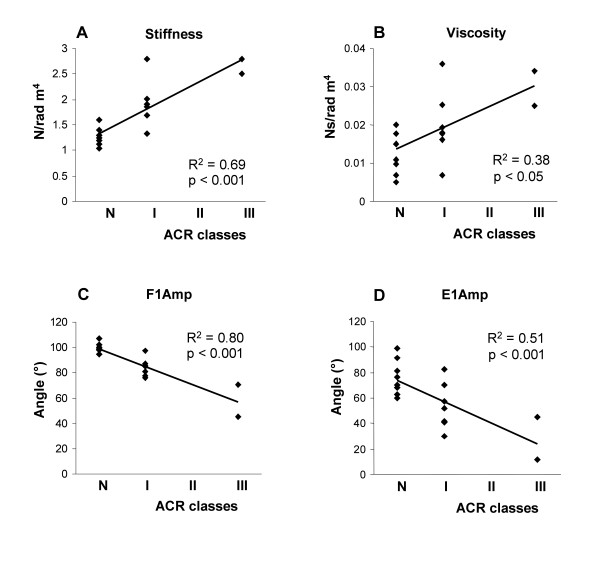
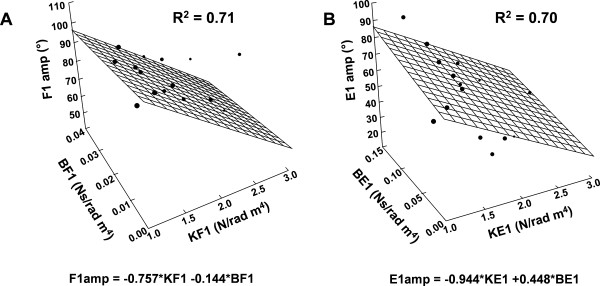
Results: Knee stiffness significantly increased (p < 0.001) in patients with respect to the control group, while differences in viscosity were not significant. Moreover, the amplitudes of first knee flexion (the maximal flexion excursion after knee release) and first knee extension (the maximal extension excursion after the first knee flexion) were significantly decreased (p < 0.001). A regression analysis showed that disease severity correlated moderately with stiffness (R2 = 0.68) and first flexion (R2 = 0.78). Using a multivariate regression, we found that increasing stiffness was the main factor for the reduction of flexion and extension motions.
Conclusion: We showed that the Wartenberg test can be considered a practical tool to measure mechanical changes of knee caused by rheumatoid arthritis. This novel application of Wartenberg test could be useful to follow up the effects of pharmacological and rehabilitative interventions in this disease.
Figures
Similar articles
-
Knee joint kinematics of the pendulum test in children with and without Down syndrome.Gait Posture. 2020 Feb;76:311-317. doi: 10.1016/j.gaitpost.2019.12.025. Epub 2019 Dec 24. Gait Posture. 2020. PMID: 31887704
-
Assessment of passive knee stiffness and viscosity in individuals with spinal cord injury using pendulum test.J Spinal Cord Med. 2015 Mar;38(2):170-7. doi: 10.1179/2045772314Y.0000000265. Epub 2014 Dec 1. J Spinal Cord Med. 2015. PMID: 25437824 Free PMC article.
-
Functional assessments of the knee joint biomechanics by using pendulum test in adults with Down syndrome.J Appl Physiol (1985). 2012 Dec 1;113(11):1747-55. doi: 10.1152/japplphysiol.00960.2012. Epub 2012 Sep 20. J Appl Physiol (1985). 2012. PMID: 22995394 Free PMC article.
-
Applicability of the Instrumented Pendulum Test for Assessing Limb Viscoelastic Properties in Neurological and Internal Diseases: A Narrative Review.Life (Basel). 2025 Mar 24;15(4):535. doi: 10.3390/life15040535. Life (Basel). 2025. PMID: 40283090 Free PMC article. Review.
-
Intra-articular pressure in rheumatoid arthritis of the knee. 3. Pressure changes during joint use.Ann Rheum Dis. 1970 Jul;29(4):401-8. doi: 10.1136/ard.29.4.401. Ann Rheum Dis. 1970. PMID: 4916771 Free PMC article. Review. No abstract available.
Cited by
-
Predictive value of the pendulum test for assessing knee extensor spasticity.J Neuroeng Rehabil. 2018 Jul 18;15(1):68. doi: 10.1186/s12984-018-0411-x. J Neuroeng Rehabil. 2018. PMID: 30021641 Free PMC article.
-
Diagnosis and treatment of movement system impairment syndromes.Braz J Phys Ther. 2017 Nov-Dec;21(6):391-399. doi: 10.1016/j.bjpt.2017.08.001. Epub 2017 Sep 27. Braz J Phys Ther. 2017. PMID: 29097026 Free PMC article. Review.
-
Techniques for assessing knee joint pain in arthritis.Mol Pain. 2007 Mar 28;3:8. doi: 10.1186/1744-8069-3-8. Mol Pain. 2007. PMID: 17391515 Free PMC article. Review.
-
Knee stiffness and viscosity: New implementation and perspectives in prosthesis development.Bosn J Basic Med Sci. 2017 May 20;17(2):164-171. doi: 10.17305/bjbms.2017.1765. Bosn J Basic Med Sci. 2017. PMID: 28422623 Free PMC article.
-
Neuromechanical Assessment of Activated vs. Resting Leg Rigidity Using the Pendulum Test Is Associated With a Fall History in People With Parkinson's Disease.Front Hum Neurosci. 2020 Dec 9;14:602595. doi: 10.3389/fnhum.2020.602595. eCollection 2020. Front Hum Neurosci. 2020. PMID: 33362496 Free PMC article.
References
-
- Pincus T, Callahan LF. What is the natural history of rheumatoid arthritis? Rheum Dis Clin North Am. 1993;19:123–151. - PubMed
-
- Wartenberg R. Pendulousness of the legs as a diagnostic test. Neurology. 1951;1:8–24. - PubMed
-
- Arnett FC, Edworthy SM, Bloch DA, McShane DJ, Fries JF, Cooper NS, Healey LA, Kaplan SR, Liang MH, Luthra HS, Medsger TA, Jr, Mitchell DM, Neustadt DH, Pinals RS, Schaller JG, Sharp JT, Wilder RL, Hunder GG. The American Rheumatism Association 1987 revised criteria for the classification of rheumatoid arthritis. Arthritis Rheum. 1988;31:315–324. - PubMed
MeSH terms
LinkOut - more resources
Full Text Sources
Medical
