Simultaneity in the millisecond range as a requirement for effective shape recognition
- PMID: 17134493
- PMCID: PMC1693915
- DOI: 10.1186/1744-9081-2-38
Simultaneity in the millisecond range as a requirement for effective shape recognition
Abstract
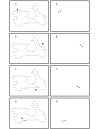
Neurons of the visual system are capable of firing with millisecond precision, and synchrony of firing may provide a mechanism for "binding" stimulus elements in the image for purposes of recognition. While the neurophysiology is suggestive, there has been relatively little behavioral work to support the proposition that synchrony contributes to object recognition. The present experiments examined this issue by briefly flashing dots that were positioned at the outer boundary of namable objects, similar to silhouettes. Display of a given dot lasted only 0.1 ms, and temporal proximity of dot pairs, and among dot pairs, was varied as subjects were asked to name each object. In Exp 1, where the display of dots pairs was essentially simultaneous (0.2 ms to show both), there was a linear decline in recognition of the shapes as the interval between pairs increased from 0 ms to 6 ms. Compared with performance at 0 ms of delay, even the 2 ms interval between pairs produced a significant decrease in recognition. In Exp 2 the interval between pairs was constant at 3 ms, and the interval between pair members was varied. Here also a linear decline was observed as the interval between pair members increased from 0 ms to 1.5 ms, with the difference between 0 ms and 0.5 ms being significant. Thus minimal transient discrete cues can be integrated for purposes of shape recognition to the extent that they are synchronously displayed, and coincidence in the millisecond and even submillisecond range is needed for effective encoding of image data.
Figures


Similar articles
-
Additional evidence that contour attributes are not essential cues for object recognition.Behav Brain Funct. 2008 Jul 1;4:26. doi: 10.1186/1744-9081-4-26. Behav Brain Funct. 2008. PMID: 18593469 Free PMC article.
-
Spatial and temporal proximity as factors in shape recognition.Behav Brain Funct. 2007 Jun 5;3:27. doi: 10.1186/1744-9081-3-27. Behav Brain Funct. 2007. PMID: 17550614 Free PMC article.
-
Retinal encoding of ultrabrief shape recognition cues.PLoS One. 2007 Sep 12;2(9):e871. doi: 10.1371/journal.pone.0000871. PLoS One. 2007. PMID: 17849001 Free PMC article.
-
Recognition of objects displayed with incomplete sets of discrete boundary dots.Percept Mot Skills. 2007 Jun;104(3 Pt 2):1043-59. doi: 10.2466/pms.104.4.1043-1059. Percept Mot Skills. 2007. PMID: 17879637
-
Neural Mechanisms Underlying Visual Object Recognition.Cold Spring Harb Symp Quant Biol. 2014;79:99-107. doi: 10.1101/sqb.2014.79.024729. Cold Spring Harb Symp Quant Biol. 2014. PMID: 26092883 Review.
Cited by
-
Evaluating the contribution of shape attributes to recognition using the minimal transient discrete cue protocol.Behav Brain Funct. 2012 Nov 12;8:53. doi: 10.1186/1744-9081-8-53. Behav Brain Funct. 2012. PMID: 23146718 Free PMC article.
-
High-resolution electrical stimulation of primate retina for epiretinal implant design.J Neurosci. 2008 Apr 23;28(17):4446-56. doi: 10.1523/JNEUROSCI.5138-07.2008. J Neurosci. 2008. PMID: 18434523 Free PMC article.
-
Additional evidence that contour attributes are not essential cues for object recognition.Behav Brain Funct. 2008 Jul 1;4:26. doi: 10.1186/1744-9081-4-26. Behav Brain Funct. 2008. PMID: 18593469 Free PMC article.
-
Microsaccades enable efficient synchrony-based coding in the retina: a simulation study.Sci Rep. 2016 Apr 11;6:24086. doi: 10.1038/srep24086. Sci Rep. 2016. PMID: 27063867 Free PMC article.
-
The integration window for shape cues is a function of ambient illumination.Behav Brain Funct. 2007 Mar 14;3:15. doi: 10.1186/1744-9081-3-15. Behav Brain Funct. 2007. PMID: 17359541 Free PMC article.
References
-
- Lettvin JY, Maturana HR, McCulloch WS, Pitts WH. What the frog's eye tells the frog's brain. Proc Inst Radio Eng. 1959;47:1940–1951.
-
- Adrian ED. The basis of sensation. New York: W.W. Norton; 1928.
LinkOut - more resources
Full Text Sources

