. 2006 Nov 29:7:299.
doi: 10.1186/1471-2164-7-299.

Genome-wide loss of heterozygosity and copy number alteration in esophageal squamous cell carcinoma using the Affymetrix GeneChip Mapping 10 K array

Affiliations

Genome-wide loss of heterozygosity and copy number alteration in esophageal squamous cell carcinoma using the Affymetrix GeneChip Mapping 10 K array

Nan Hu et al. BMC Genomics. .

Abstract

Background: Esophageal squamous cell carcinoma (ESCC) is a common malignancy worldwide. Comprehensive genomic characterization of ESCC will further our understanding of the carcinogenesis process in this disease.

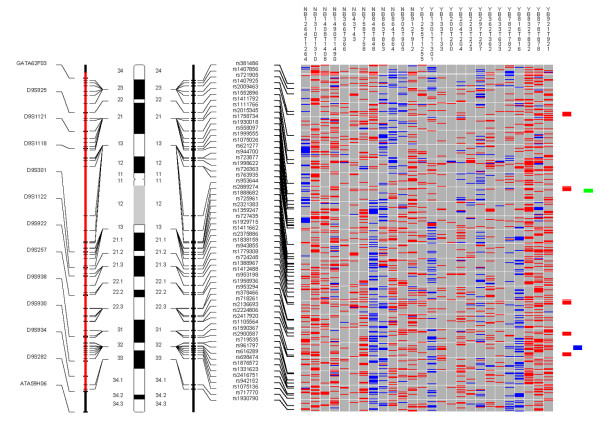
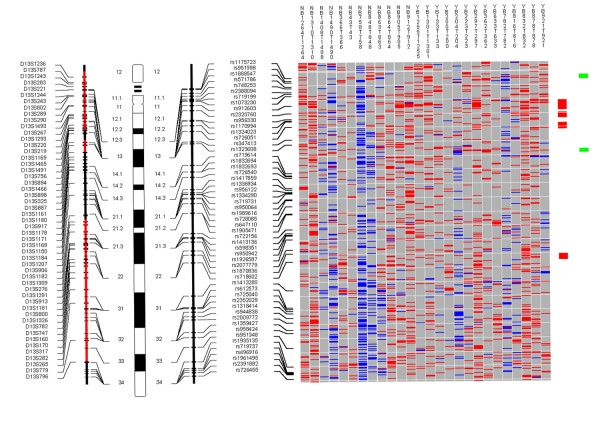
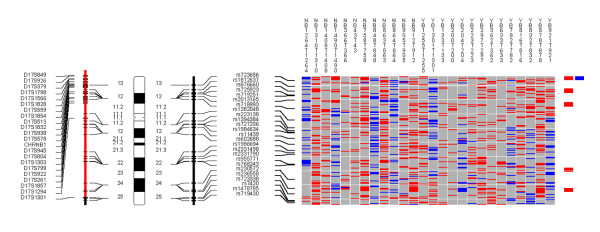
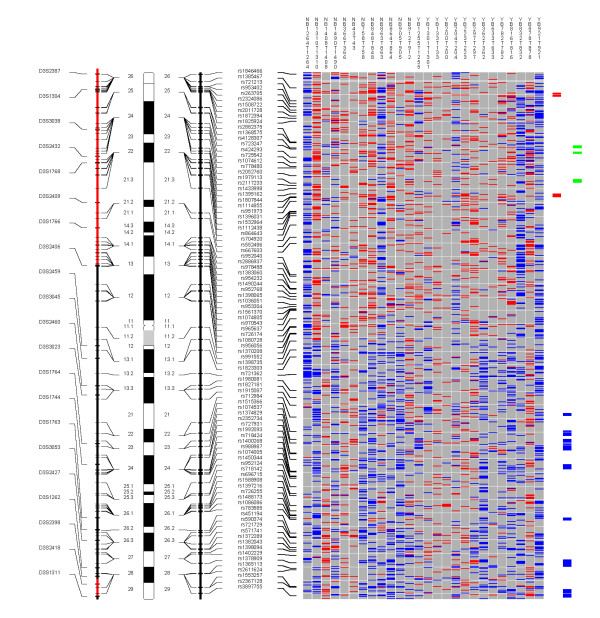
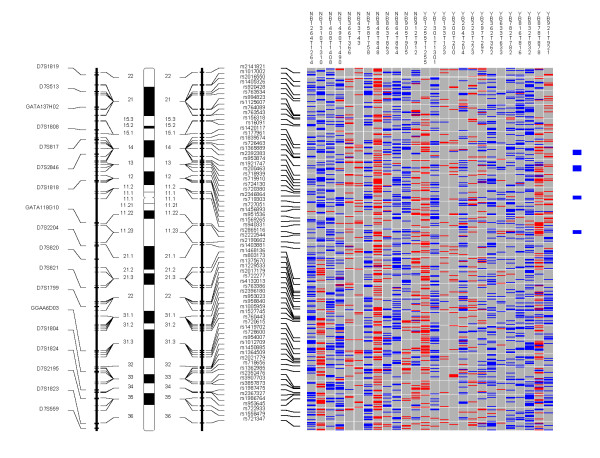
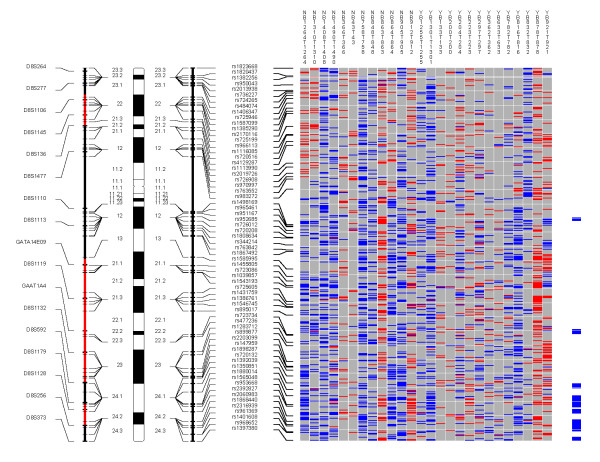
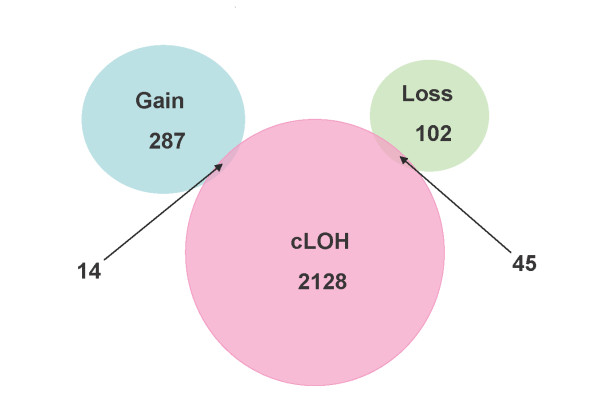
Results: Genome-wide detection of chromosomal changes was performed using the Affymetrix GeneChip 10 K single nucleotide polymorphism (SNP) array, including loss of heterozygosity (LOH) and copy number alterations (CNA), for 26 pairs of matched germ-line and micro-dissected tumor DNA samples. LOH regions were identified by two methods--using Affymetrix's genotype call software and using Affymetrix's copy number alteration tool (CNAT) software--and both approaches yielded similar results. Non-random LOH regions were found on 10 chromosomal arms (in decreasing order of frequency: 17p, 9p, 9q, 13q, 17q, 4q, 4p, 3p, 15q, and 5q), including 20 novel LOH regions (10 kb to 4.26 Mb). Fifteen CNA-loss regions (200 kb to 4.3 Mb) and 36 CNA-gain regions (200 kb to 9.3 Mb) were also identified.

Conclusion: These studies demonstrate that the Affymetrix 10 K SNP chip is a valid platform to integrate analyses of LOH and CNA. The comprehensive knowledge gained from this analysis will enable improved strategies to prevent, diagnose, and treat ESCC.


Figures

Figure 1
Figure 1
Chromosome 9. Each column in the picture represents an individual case and shows genotyping in germ-line DNA and matched micro-dissected tumor; LOH is shown in red, retention in blue, and homozygous or "no call" in grey. B indicates blood DNA and T indicates tumor DNA (from matched, micro-dissected sample). To the left of the picture, columns show (from left to right): microsatellite markers, cartoon of the chromosome, and SNPs examined in the 10 K SNP chip. To the right of the picture, red bars show deletion regions (as defined from our conservative "LOH/Model A"), blue bars show regions with CNA losses (from CNAT), and green bars show regions with CNA gains (from CNAT).
Figure 2
Figure 2
Chromosome 13. Each column in the picture represents an individual case and shows genotyping in germ-line DNA and matched micro-dissected tumor; LOH is shown in red, retention in blue, and homozygous or "no call" in grey. B indicates blood DNA and T indicates tumor DNA (from matched, micro-dissected sample). To the left of the picture, columns show (from left to right): microsatellite markers, cartoon of the chromosome, and SNPs examined in the 10 K SNP chip. To the right of the picture, red bars show deletion regions (as defined from our conservative "LOH/Model A"), blue bars show regions with CNA losses (from CNAT), and green bars show regions with CNA gains (from CNAT).
Figure 3
Figure 3
Chromosome 17. Each column in the picture represents an individual case and shows genotyping in germ-line DNA and matched micro-dissected tumor; LOH is shown in red, retention in blue, and homozygous or "no call" in grey. B indicates blood DNA and T indicates tumor DNA (from matched, micro-dissected sample). To the left of the picture, columns show (from left to right): microsatellite markers, cartoon of the chromosome, and SNPs examined in the 10 K SNP chip. To the right of the picture, red bars show deletion regions (as defined from our conservative "LOH/Model A"), blue bars show regions with CNA losses (from CNAT), and green bars show regions with CNA gains (from CNAT).
Figure 4
Figure 4
Chromosome 3. Each column in the picture represents an individual case and shows genotyping in germ-line DNA and matched micro-dissected tumor; LOH is shown in red, retention in blue, and homozygous or "no call" in grey. B indicates blood DNA and T indicates tumor DNA (from matched, micro-dissected sample). To the left of the picture, columns show (from left to right): microsatellite markers, cartoon of the chromosome, and SNPs examined in the 10 K SNP chip. To the right of the picture, red bars show deletion regions (as defined from our conservative "LOH/Model A"), blue bars show regions with CNA losses (from CNAT), and green bars show regions with CNA gains (from CNAT).
Figure 5
Figure 5
Chromosome 7. Each column in the picture represents an individual case and shows genotyping in germ-line DNA and matched micro-dissected tumor; LOH is shown in red, retention in blue, and homozygous or "no call" in grey. B indicates blood DNA and T indicates tumor DNA (from matched, micro-dissected sample). To the left of the picture, columns show (from left to right): microsatellite markers, cartoon of the chromosome, and SNPs examined in the 10 K SNP chip. To the right of the picture, red bars show deletion regions (as defined from our conservative "LOH/Model A"), blue bars show regions with CNA losses (from CNAT), and green bars show regions with CNA gains (from CNAT).
Figure 6
Figure 6
Chromosome 8. Each column in the picture represents an individual case and shows genotyping in germ-line DNA and matched micro-dissected tumor; LOH is shown in red, retention in blue, and homozygous or "no call" in grey. B indicates blood DNA and T indicates tumor DNA (from matched, micro-dissected sample). To the left of the picture, columns show (from left to right): microsatellite markers, cartoon of the chromosome, and SNPs examined in the 10 K SNP chip. To the right of the picture, red bars show deletion regions (as defined from our conservative "LOH/Model A"), blue bars show regions with CNA losses (from CNAT), and green bars show regions with CNA gains (from CNAT).
Figure 7
Figure 7
Comparison of SNPs with cLOH (from our less conservative "cLOH/Model B") and CNAs (from CNAT software using pooled DNA from normal controls).

Similar articles

Cited by

References

    1. Maris JM, Hii G, Gelfand CA, Varde S, White PS, Rappaport E, Surrey S, Fortina P. Region-specific detection of neuroblastoma loss of heterozygosity at multiple loci simultaneously using a SNP-based tag-array platform. Genome Res. 2005;15:1168–1176. doi: 10.1101/gr.3865305. - DOI - PMC - PubMed
    1. Phillips MS, Lawrence R, Sachidanandam R, Morris AP, Balding DJ, Donaldson MA, Studebaker JF, Ankener WM, Alfisi SV, Kuo FS, Camisa AL, Pazorov V, Scott KE, Carey BJ, Faith J, Katari G, Bhatti HA, Cyr JM, Derohannessian V, Elosua C, Forman AM, Grecco NM, Hock CR, Kuebler JM, Lathrop JA, Mockler MA, Nachtman EP, Restine SL, Varde SA, Hozza MJ, Gelfand CA, Broxholme J, Abecasis GR, Boyce-Jacino MT, Cardon LR. Chromosome-wide distribution of haplotype blocks and the role of recombination hot spots. Nat Genet. 2003;33:382–387. doi: 10.1038/ng1100. - DOI - PubMed
    1. Zhao X, Li C, Paez JG, Chin K, Janne PA, Chen TH, Girard L, Minna J, Christiani D, Leo C, Gray JW, Sellers WR, Meyerson M. An integrated view of copy number and allelic alterations in the cancer genome using single nucleotide polymorphism arrays. Cancer Res. 2004;64:3060–3071. doi: 10.1158/0008-5472.CAN-03-3308. - DOI - PubMed
    1. Janne PA, Li C, Zhao X, Girard L, Chen TH, Minna J, Christiani DC, Johnson BE, Meyerson M. High-resolution single-nucleotide polymorphism array and clustering analysis of loss of heterozygosity in human lung cancer cell lines. Oncogene. 2004;23:2716–2726. doi: 10.1038/sj.onc.1207329. - DOI - PubMed
    1. Wong KK, Tsang YT, Shen J, Cheng RS, Chang YM, Man TK, Lau CC. Allelic imbalance analysis by high-density single-nucleotide polymorphic allele (SNP) array with whole genome amplified DNA. Nucleic Acids Res. 2004;32:e69. doi: 10.1093/nar/gnh072. - DOI - PMC - PubMed

Publication types