. 2007 Mar;81(3):741-7.
doi: 10.1189/jlb.0806540. Epub 2006 Nov 29.

Hydrogen peroxide stimulates macrophages and monocytes to actively release HMGB1

Affiliations

Hydrogen peroxide stimulates macrophages and monocytes to actively release HMGB1

Daolin Tang et al. J Leukoc Biol. 2007 Mar.

Abstract

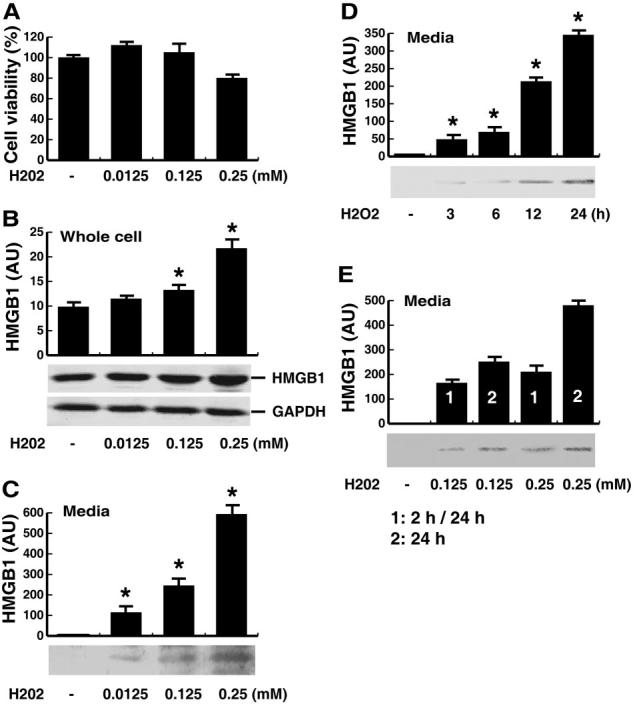
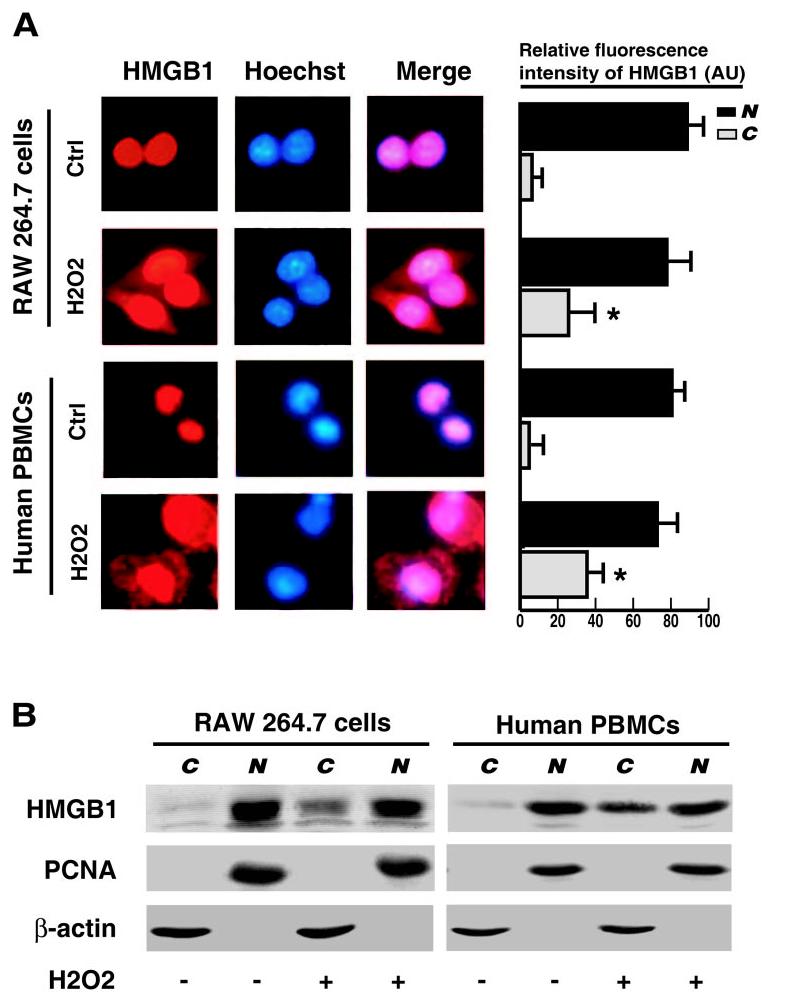
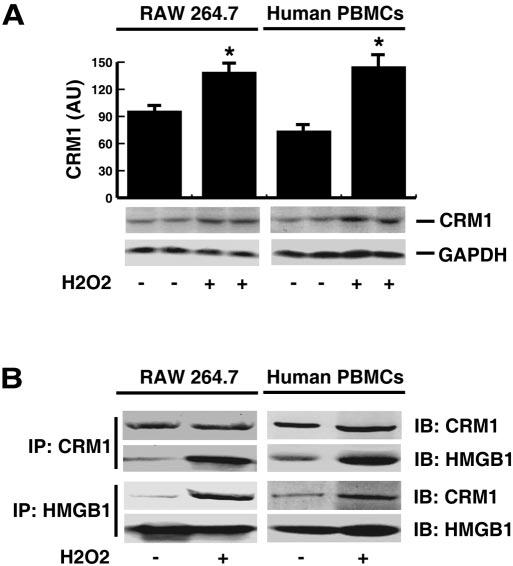
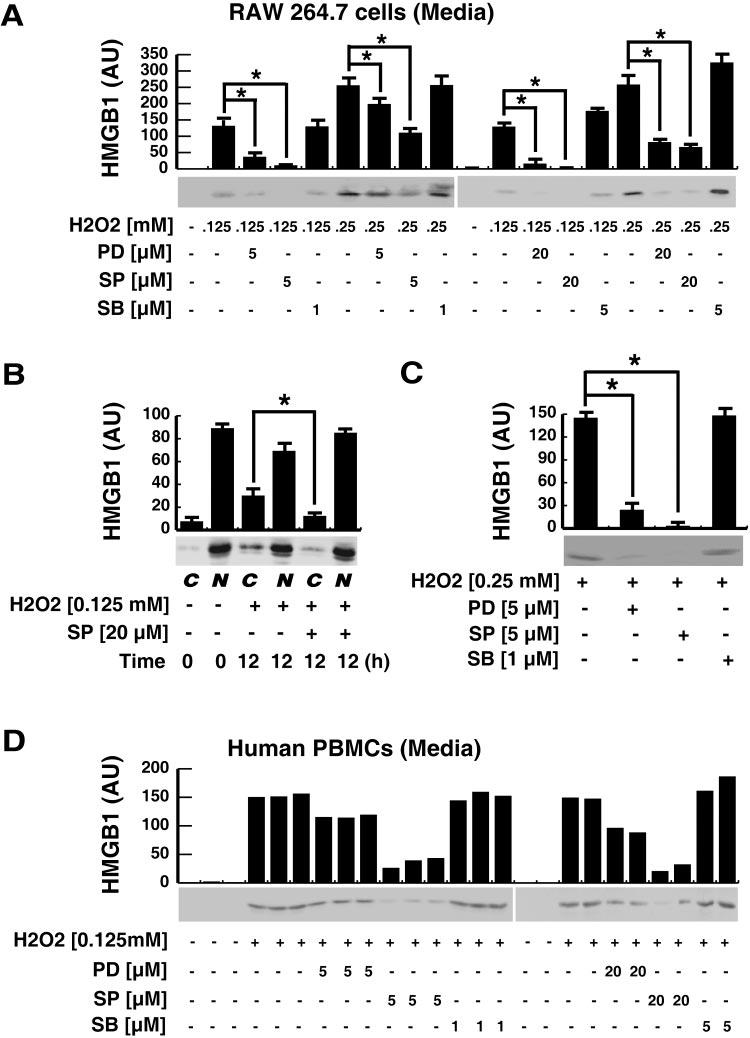
High mobility group box 1 (HMGB1) can be actively secreted by macrophages/monocytes in response to exogenous and endogenous inflammatory stimuli (such as bacterial endotoxin, TNF-alpha, IL-1, and IFN-gamma) or passively released by necrotic cells and mediates innate and adaptive inflammatory responses to infection and injury. Here, we demonstrated that a reactive oxygen species, hydrogen peroxide (H(2)O(2)), induces active and passive HMGB1 release from macrophage and monocyte cultures in a time- and dose-dependent manner. At nontoxic doses (e.g., 0.0125-0.125 mM), H(2)O(2) induced HMGB1 cytoplasmic translocation and active release within 3-24 h. At higher concentrations (e.g., 0.25 mM), however, H(2)O(2) exhibited cytotoxicity to macrophage and monocyte cell cultures and consequently, triggered active and passive HMGB1 release. In addition, H(2)O(2) stimulated potential interaction of HMGB1 with a nuclear export factor, chromosome region maintenance (CRM1), in macrophage/monocyte cultures. Inhibitors specific for the JNK (SP600125) and MEK (PD98059), but not p38 MAPK (SB203580), abrogated H(2)O(2)-induced, active HMGB1 release. Together, these data establish an important role for oxidative stress in inducing active HMGB1 release, potentially through a MAPK- and CRM1-dependent mechanism.


Figures

Fig. 1
Fig. 1
Effects of H2O2 on the release of HMGB1 in macrophage cultures. (A) RAW 264.7 macrophages were stimulated with H2O2 at indicated doses for 24 h, and cell viability was determined by MTT assay and expressed as mean ± sem of four experiments in duplicate. In parallel experiments, HMGB1 levels in the whole-cell lysate (B) or culture medium (C–E) were determined by the relative optical intensity [in arbitrary units (AU)] of the immunoreactive bands on Western blots and expressed as mean ±sem of three experiments in duplicate. *, Statistically significant versus control group; P < 0.05. (D) Levels of HMGB1 in the culture medium at various time-points following stimulation with H2O2 at a nontoxic dose (0.125 mM). (E) Levels of HMGB1 in the culture medium at 24 h after the onset of a brief (for 2 h, after which H2O2 was washed out; marked as “1” or “2 h/24 h”) or a persistent (for 24 h; marked as “2” or “24 h”) exposure to H2O2 at indicated concentrations.
Fig. 2
Fig. 2
Effects of H2O2 on HMGB1 cytoplasmic translocation in macrophage and monocyte cultures. RAW 264.7 macrophages and human PBMCs were stimulated with H2O2 at a nontoxic concentration (0.125 mM) and monitored for HMGB1 cytoplasmic translocation by immunocytochemistry (A) or cell fractionation/Western blot (B) at 12 h poststimulation (A). The relative fluorescence intensity in the nuclear (“N”) or cytoplasmic (“C”) regions of multiple representative cells was determined using the ImageProPlus software and expressed as mean ± sem (in arbitrary units) of three independent experiments. Red, HMGB1; blue, nuclei; pink, Merge (original magnification, ×400). (B) Following cell fractionation, HMGB1 content in the cytoplasmic (“C”) or nuclear (“N”) fraction was determined by Western blotting analysis. Equal loading of samples was confirmed by Western blotting analysis of each fraction with antibodies specific for a nuclear (PCNA, BD Biosciences) or cytoplasmic (β-actin, KangChen Biotechnology) protein. Blots are representative of three independent experiments with similar results.
Fig. 3
Fig. 3
Effects of H2O2 on CRM1 expression and interaction with HMGB1 in macrophage and monocytes cultures. (A) RAW 264.7 macrophages and human PBMCs were stimulated with H2O2 at a nontoxic concentration (0.125 mM) for 24 h, and whole-cell lysate assayed CRM1 content by Western blotting analysis. Shown in the bar graph was the relative optical intensity (in arbitrary units) of the CRM1-immunoreactive band. A cytoplasmic housekeeping protein, GAPDH, was used as a loading control. In parallel experiments, nuclear fractions were isolated and immunoprecipitated (“IP”) with CRM1- or HMGB1-specific antibodies. The precipitated proteins were subsequently immunoblotted (“IB”) with CRM1- or HMGB1-specific antibodies. Blot shown is representative of three experiments with similar results.
Fig. 4
Fig. 4
Effects of MAPK inhibitors on H2O2-induced HMGB1 translocation and release in macrophage and monocyte cultures. (A, B) RAW 264.7 macrophages were pretreated with various MAPK inhibitors [SB203580 (SB), SP600125 (SP), PD98059 (PD)] at indicated concentrations for 30 min before stimulation with H2O2 at indicated doses. At 12 h post-H2O2 stimulation, levels of HMGB1 in the culture medium (A) or cellular cytoplasmic or nuclear fractions (B) were determined by Western blotting analysis, and the relative optical intensity of HMGB1-immunoreactive band (in arbitrary units) was expressed as mean ± sem of three experiments in duplicate. *, P < 0.05. (C) RAW 264.7 macrophages were pretreated with various MAPK inhibitors for 30 min before exposure to 0.25 mM H2O2. At 2 h post-H2O2 stimulation, H2O2 was washed out, and HMGB1 levels in the culture medium were determined at 24 h after the onset of H2O2 exposure. The relative optical intensity of HMGB1-immunoreactive band (in arbitrary units) was expressed as mean ± sem of three experiments in duplicate. *, P < 0.05. (D) Human PBMCs (n = 5 per group) were similarly pretreated with various MAPK inhibitors (SB203580, SP600125, PD98059), at indicated concentrations for 30 min before addition of H2O2 (0.125 mM). At 6 h post-H2O2 stimulation, the levels of HMGB1 in the culture medium were assayed by Western blotting analysis and expressed as the relative optical intensity of a HMGB1-immunoreactive band (in arbitrary units). Blots are representative of three independent experiments with similar results.

References

    1. Bergamini CM, Gambetti S, Dondi A, Cervellati C. Oxygen, reactive oxygen species and tissue damage. Curr. Pharm. Des. 2004;10:1611–1626. - PubMed
    1. Pouyssegur J. Signal transduction. An arresting start for MAPK. Science. 2000;290:1515–1518. - PubMed
    1. Kamata H, Honda S, Maeda S, Chang L, Hirata H, Karin M. Reactive oxygen species promote TNFα-induced death and sustained JNK activation by inhibiting MAP kinase phosphatases. Cell. 2005;120:649–661. - PubMed
    1. Handley ME, Thakker M, Pollara G, Chain BM, Katz DR. JNK activation limits dendritic cell maturation in response to reactive oxygen species by the induction of apoptosis. Free Radic. Biol. Med. 2005;38:1637–1652. - PubMed
    1. Wang H, Bloom O, Zhang M, Vishnubhakat JM, Ombrellino M, Che J, Frazier A, Yang H, Ivanova S, Borovikova L, Manogue KR, Faist E, Abraham E, Andersson J, Andersson U, Molina PE, Abumrad NN, Sama A, Tracey KJ. HMG-1 as a late mediator of endotoxin lethality in mice. Science. 1999;285:248–251. - PubMed

Publication types

MeSH terms