. 2006 Nov 30:6:291.
doi: 10.1186/1471-2458-6-291.

Levels and trends of demographic indices in southern rural Mozambique: evidence from demographic surveillance in Manhiça district

Affiliations

Levels and trends of demographic indices in southern rural Mozambique: evidence from demographic surveillance in Manhiça district

Ariel Q Nhacolo et al. BMC Public Health. .

Abstract

Background: In Mozambique most of demographic data are obtained using census or sample survey including indirect estimations. A method of collecting longitudinal demographic data was introduced in southern Mozambique since 1996 (DSS -Demographic Surveillance System in Manhiça district, Maputo province), but the extent to which it yields demographic measures that are typical of southern rural Mozambique has not been evaluated yet.

Methods: Data from the DSS were used to estimate the levels and trends of fertility, mortality and migration in Manhiça, between 1998 and 2005. The estimates from Manhiça were compared with estimates from Maputo province using the 1997 National census and 1997 Demographic and Health Survey (DHS). The DHS data were used to estimate levels and trends of adult mortality using the siblings' histories and the orphanhood methods.

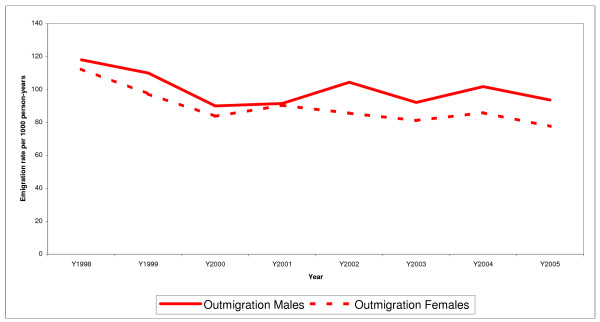
Results: The populations in Manhiça and in Maputo province are young (44% <15 years in Manhiça and 42% in Maputo); with reduced adult males when compared to females (all ages sex ratio of 78.7 in Manhiça and 89 in Maputo). Fertility in Manhiça is at a similar level as in Maputo province and has remained around 5 children per woman, during the eight years of surveillance in Manhiça. Although the infant mortality rate (IMR) in Mozambique has decreased during the last two decades (from 148 deaths per 1000 live births in 1980 to 101 in 2003), it has remained stable around 80 in Manhiça during the surveillance period. Adult mortality has increased both in Manhiça (probability of dying from ages 15 to 60 increased from 0.4 in 1998 to 0.6 in 2005 in Manhiça, from 0.3 in 1992 to 0.4 in 1997 in Maputo province and from 0.1 in 1980 to 0.6 in 2000 in Mozambique). Consequently, the life expectancy decreased from 53 to 46 in Manhiça and from 42 years in 1997 to 38 in 2004 in Mozambique. Migration is high in Manhiça but tends to stabilise after the movements of resettlement that followed the end of the civil war in 1992.

Conclusion: The population under demographic surveillance in Manhiça district presents characteristics that are typical of southern rural Mozambique, with predominance of young people and reduction of adult males. Labour migration and excess adult male mortality are the major factors for the reduction of adult males. Mortality is high and only infant mortality has started to stabilise while adult mortality has increased, and as consequence, life expectancy has decreased. The Manhiça DSS is an adequate tool to report demographic measures for southern rural Mozambique.


Figures

Figure 1
Figure 1
Population pyramids, Manhiça 1998–2005 and Maputo province, 1997. Calculated from the Manhiça DSS data and the 1997 census data [16].
Figure 2
Figure 2
Age-specific fertility rates, Manhiça 1998–2005; Maputo province, 1997 and Mozambique, 1997. Calculated from the Manhiça DSS data and the 1997 census data [16]. Manhiça98-05 – age-specific fertility rate per 1000 in Manhiça DSS area, 1998–2005. Maputo97 – age-specific fertility rate per 1000 in Maputo province, 1997. Mozambique97 – age-specific fertility rate per 1000 in Mozambique, 1997.
Figure 3
Figure 3
Mortality rates by age and sex in Manhiça 1998–2005 and Maputo province, 1997. Calculated from the Manhiça DSS data and the 1997 census data [16]. Males Manhica – age-specific mortality rate for males in Manhiça DSS area, 1998–2005. Females Manhica – age-specific mortality rate for females in Manhiça DSS area, 1998–2005. Males Maputo – age-specific mortality rate for males in Maputo province, 1997. Females Maputo – age-specific mortality rate for females in Maputo province, 1997. Note: Mortality rate ratio comparing males to females after controlling for age in Manhiça was 1.427, 95% CI = 1.291 - 1.578 and P < 0.001.
Figure 4
Figure 4
Levels and trends of infant mortality rate, Manhiça 1998–2005, Maputo province 1980–2003 and Mozambique 1980–2003. Manhiça DSS data and [7,16–18]. IMR_Mozambique – infant mortality rate per 1000 live births, Mozambique. Data for 2003 refers to a period 10 years before the Demographic and Health Survey date, 2003. IMR_Manhica – infant mortality rate per 1000 live births, Manhiça DSS. Note: There is no evidence that the incidence of IMR changes with the year (P-value of the Likelihood Ratio Test using the Poisson regression for linear vs null model was 0.787, and for categorical vs linear was 0.116); IMR_Maputo – infant mortality rate per 1000 live births, Maputo province. Data for 2003 refers to a period 10 years before the Demographic and Health Survey date, 2003.
Figure 5
Figure 5
Trends of the probability of dying between ages 15 and 60 years, Manhiça 1998–2005 and Mozambique, 1980–2000. Siblings – 45q15 estimated from the 1997 DHS data, Mozambique, using the siblings histories methods; Orphanhood – 45q15 estimated from the 1997 DHS data, Mozambique, using the orphanhood method; Census – 45q15 estimated from the 1997 Census data, Mozambique; Manhiça – 45q15 estimated from the Manhiça DSS data. The reported trend is statistically significant (P-value of the Likelihood Ratio Test using the Poisson regression was <0.001 for both linear vs null models and categorical vs linear models); Cid.Maputo – 45q15 estimates for Maputo city, 1994 [19]; WHO – 45q15 estimates for Mozambique from WHO reports [11–13].
Figure 6
Figure 6
Levels and trends of migration, Manhiça DSS, 1998 to 2005 and Maputo province, 1992–1997. Outmigration Manhiça – emigration rate per 1000 person-years, both sexes, Manhiça DSS. Imigration Manhiça – immigration rate per 1000 person-years, both sexes, Manhiça DSS. Internal migration Manhica – internal migration rate per 1000 person-years, both sexes, Manhiça DSS. The reported trend is statistically significant (P-value for the Likelihood Ratio Test using the Poisson regression for both linear vs null model and categorical vs linear models was <0.001). Outmigration Maputo – emigration rate per 1000, both sexes, Maputo province. Imigration Maputo – immigration rate per 1000, both sexes, Maputo province. The rate for 1992–97 in Maputo province were calculated by the Instituto Nacional de Estatistica [15], by comparing place of residence in 1992 and place of residence in 1997. The rates for 1996–97 were calculated by comparing place of residence in 1996 and place of residence in 1997.
Figure 7
Figure 7
Levels and trends of emigration by sex, Manhiça, 1998 to 2005. Calculated from the Manhiça DSS data. Outmigration Males – emigration rate per 1000 person-years, males, Manhiça DSS area. Outmigration Females – emigration rate per 1000 person-years, females, Manhiça DSS area. Emigration rate ratio comparing males to females, after controlling for age was 1.173, 95% CI = 1.119 - 1.229 and P < 0.001.
Figure 8
Figure 8
Levels and trends of immigration by sex, Manhiça, 1998 to 2005. Calculated from the Manhiça DSS data. Imigration Males – immigration rate per 1000 person-years, males Manhiça DSS. Imigration Females – immigration rate per 1000 person-years, females Manhiça DSS. Immigration rate ratio comparing males to females, after controlling for age was 1.132, 95% CI = 1.080 - 1.119 and P = 0.007.
Figure 9
Figure 9
Levels and trends of internal migration by sex, Manhiça, 1998 to 2005. Calculated from the Manhiça DSS data. Internal migration males – internal migration rate per 1000 person-years, males Manhiça DSS. Internal migration females – emigration rate per 1000 person-years, females Manhiça DSS. Internal migration rate ratio comparing males to females, after controlling for age was 0.734, 95% CI = 0.701 - 0.768 and P < 0.001.
Figure 10
Figure 10
Age-and-sex-specific emigration rates, Manhiça DSS 1998–2005. Calculated from the Manhiça DSS data. Outmigration males – age-specific emigration rate per 1000 person-years, males. Outmigration females – age-specific emigration rate per 1000 persons-years, females.
Figure 11
Figure 11
Age-and-sex-specific immigration rates, Manhiça DSS 1998–2005. Calculated from the Manhiça DSS data. Imigration males – age-specific immigration rate per 1000 person-years, males. Imigration females – age-specific immigration rate per 1000 persons-years, females.
Figure 12
Figure 12
Age-and-sex-specific internal migration rates, Manhiça DSS 1998–2005. Calculated from the Manhiça DSS data. Internal migration males – age-specific internal migration rate per 1000 person-years, males. Internal migration females – age-specific internal migration rate per 1000 persons-years, females.

References

    1. Timaeus I, Garaham W. CPS Working paper N0 88-4. London, UK, Centre for Population Studies. London School of Hygiene and Tropical Medicine. University of London.; 1988. Measuring adult mortality in developing countries: a review and assessment of methods.
    1. Blacker J. The estimation of adult mortality in Africa from data on orphanhood. Population Studies. 1977;31,1. - PubMed
    1. Alonso P, Saute F, Aponte J, Gomez-Olive F, Nhacolo A, Thompson R, et al. Population and health in developing countries. Vol. 1. Ottawa, Cairo, Dakar, Montevideo, Nairobi, New Deli, Singapore., International Development Research Centre (IDRC); 2002. Manhiça Demographic Surveillance System, Mozambique; pp. 295–308.
    1. Timaeus I, Zaba B, Blacker J. Estimation of adult mortality from data on adult siblings. . In: B Z and J B, editor. Brass Tacks Essays in Medical Demography A tribute to the memory of Professor William Brass. London and New York, Athlone Press; 2001. pp. 43–66.
    1. (INE) INE. Características sócio-económicas das comunidades rurais em Moçambique, 2002/3. Relatório final. Maputo, Mocambique, Instituto Nacional de Estatistica; 2003. - PubMed

Publication types

MeSH terms