

Thiamine deficiency induces endoplasmic reticulum stress in neurons
- PMID: 17137721
- PMCID: PMC1819404
- DOI: 10.1016/j.neuroscience.2006.10.008
Thiamine deficiency induces endoplasmic reticulum stress in neurons
Abstract
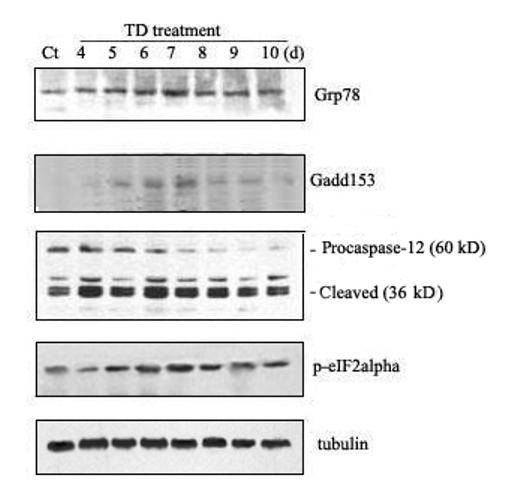
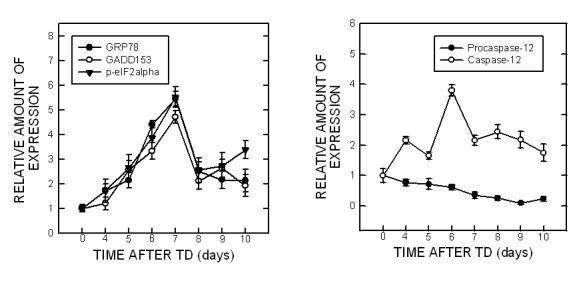
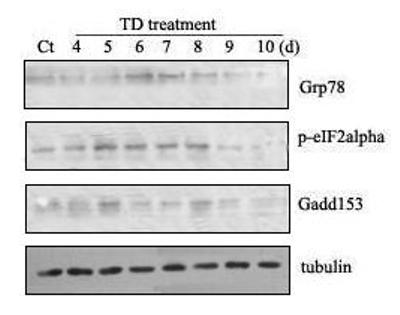
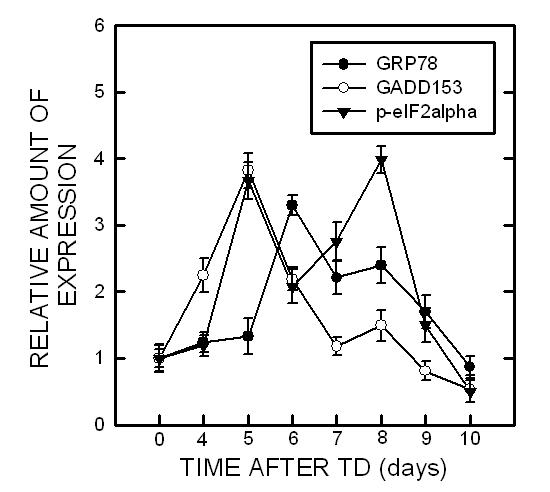
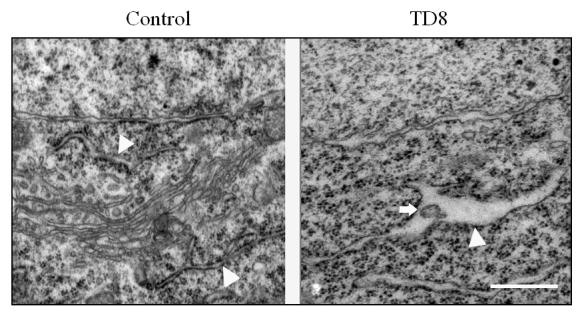
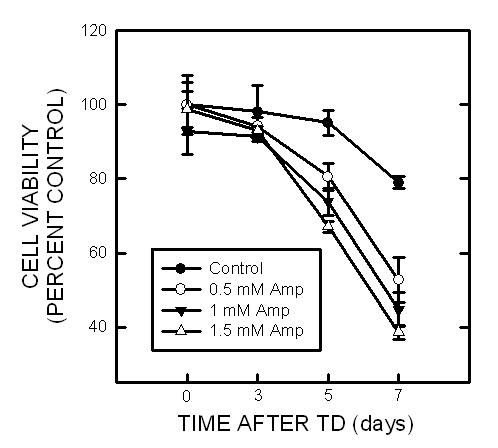
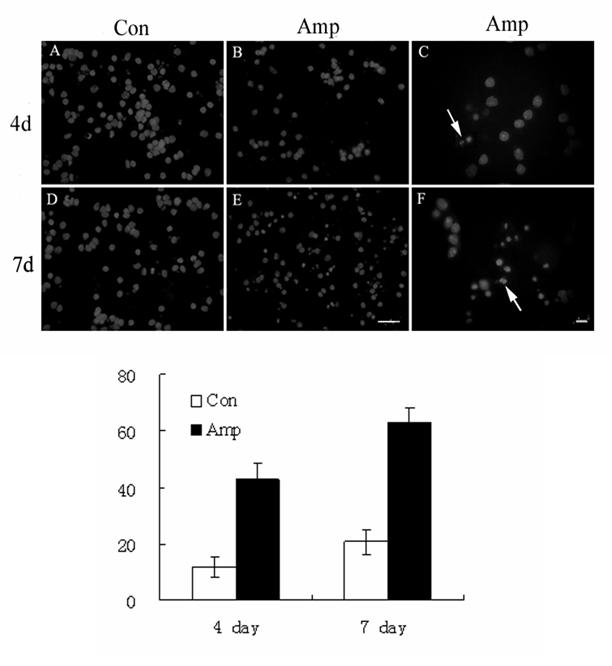
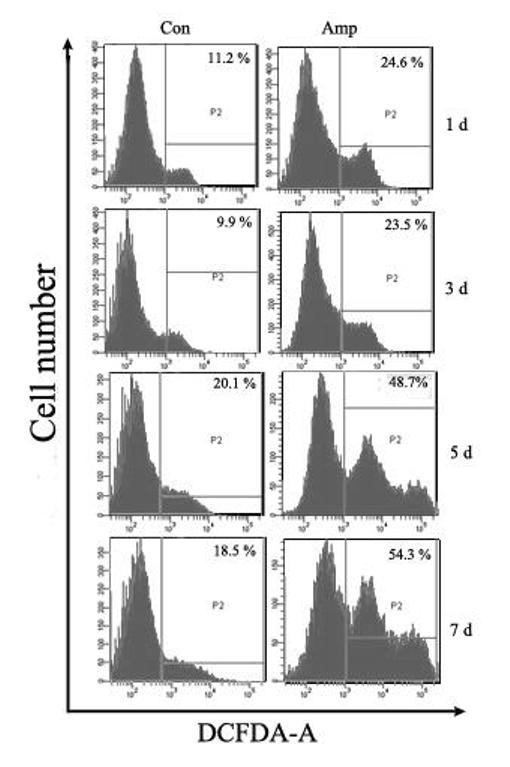
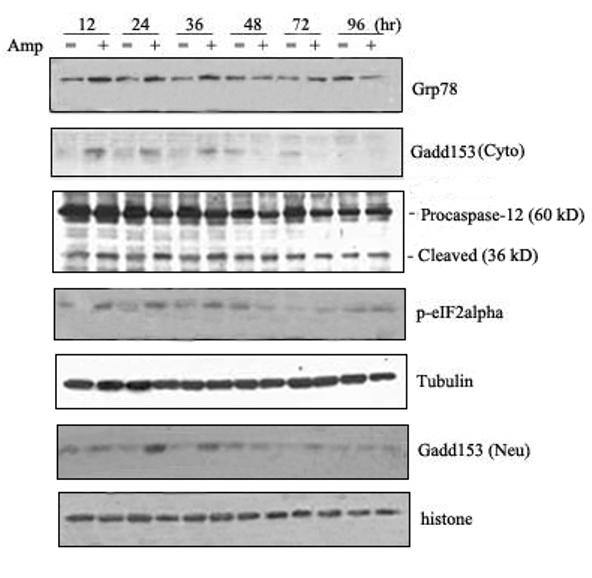
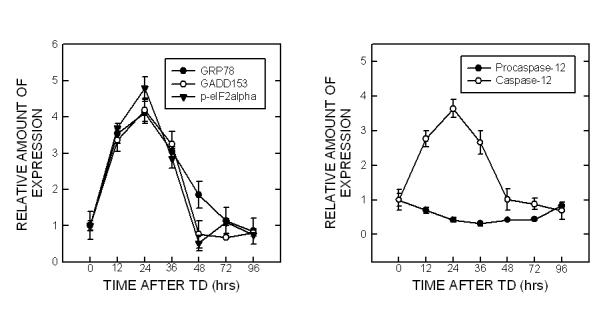
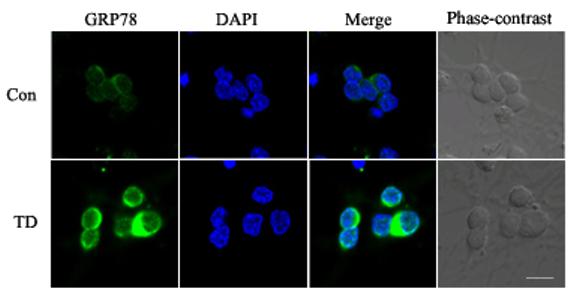
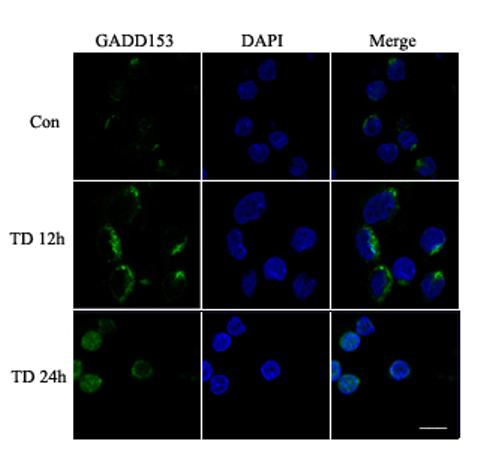
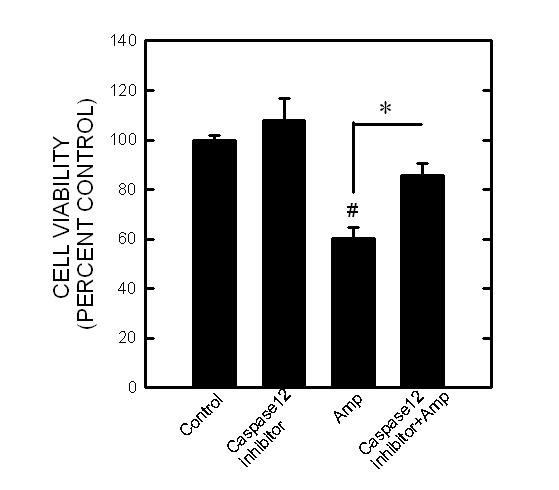
Thiamine (vitamin B1) deficiency (TD) causes region selective neuronal loss in the brain; it has been used to model neurodegeneration that accompanies mild impairment of oxidative metabolism. The mechanisms for TD-induced neurodegeneration remain incompletely elucidated. Inhibition of protein glycosylation, perturbation of calcium homeostasis and reduction of disulfide bonds provoke the accumulation of unfolded proteins in the endoplasmic reticulum (ER), and cause ER stress. Recently, ER stress has been implicated in a number of neurodegenerative models. We demonstrated here that TD up-regulated several markers of ER stress, such as glucose-regulated protein (GRP) 78, growth arrest and DNA-damage inducible protein or C/EBP-homologus protein (GADD153/Chop), phosphorylation of eIF2alpha and cleavage of caspase-12 in the cerebellum and the thalamus of mice. Furthermore, ultrastructural analysis by electron microscopic study revealed an abnormality in ER structure. To establish an in vitro model of TD in neurons, we treated cultured cerebellar granule neurons (CGNs) with amprolium, a potent inhibitor of thiamine transport. Exposure to amprolium caused apoptosis and the generation of reactive oxygen species in CGNs. Similar to the observation in vivo, TD up-regulated markers for ER stress. Treatment of a selective inhibitor of caspase-12 significantly alleviated amprolium-induced death of CGNs. Thus, ER stress may play a role in TD-induced brain damage.
Figures
Similar articles
-
Thiamine deficiency induces endoplasmic reticulum stress and oxidative stress in human neurons derived from induced pluripotent stem cells.Toxicol Appl Pharmacol. 2017 Apr 1;320:26-31. doi: 10.1016/j.taap.2017.02.009. Epub 2017 Feb 11. Toxicol Appl Pharmacol. 2017. PMID: 28193519 Free PMC article.
-
Ethanol promotes thiamine deficiency-induced neuronal death: involvement of double-stranded RNA-activated protein kinase.Alcohol Clin Exp Res. 2009 Jun;33(6):1097-103. doi: 10.1111/j.1530-0277.2009.00931.x. Epub 2009 Mar 23. Alcohol Clin Exp Res. 2009. PMID: 19382901 Free PMC article.
-
Activation of double-stranded RNA-activated protein kinase by mild impairment of oxidative metabolism in neurons.J Neurochem. 2007 Dec;103(6):2380-90. doi: 10.1111/j.1471-4159.2007.04978.x. Epub 2007 Oct 22. J Neurochem. 2007. PMID: 17953670
-
Thiamine Deficiency and Neurodegeneration: the Interplay Among Oxidative Stress, Endoplasmic Reticulum Stress, and Autophagy.Mol Neurobiol. 2017 Sep;54(7):5440-5448. doi: 10.1007/s12035-016-0079-9. Epub 2016 Sep 5. Mol Neurobiol. 2017. PMID: 27596507 Free PMC article. Review.
-
Selective response of various brain cell types during neurodegeneration induced by mild impairment of oxidative metabolism.Neurochem Int. 2004 Jul-Aug;45(2-3):361-9. doi: 10.1016/j.neuint.2003.09.008. Neurochem Int. 2004. PMID: 15145550 Review.
Cited by
-
Vitamin B1-deficient mice show impairment of hippocampus-dependent memory formation and loss of hippocampal neurons and dendritic spines: potential microendophenotypes of Wernicke-Korsakoff syndrome.Biosci Biotechnol Biochem. 2016 Dec;80(12):2425-2436. doi: 10.1080/09168451.2016.1224639. Epub 2016 Aug 31. Biosci Biotechnol Biochem. 2016. PMID: 27576603 Free PMC article.
-
Autophagy is involved in oligodendroglial precursor-mediated clearance of amyloid peptide.Mol Neurodegener. 2013 Aug 10;8:27. doi: 10.1186/1750-1326-8-27. Mol Neurodegener. 2013. PMID: 23938027 Free PMC article.
-
Thiamine deficiency: an update of pathophysiologic mechanisms and future therapeutic considerations.Neurochem Res. 2015 Feb;40(2):353-61. doi: 10.1007/s11064-014-1430-z. Epub 2014 Oct 9. Neurochem Res. 2015. PMID: 25297573 Review.
-
Responses of the mitochondrial alpha-ketoglutarate dehydrogenase complex to thiamine deficiency may contribute to regional selective vulnerability.Neurochem Int. 2007 Jun;50(7-8):921-31. doi: 10.1016/j.neuint.2007.03.010. Epub 2007 Apr 7. Neurochem Int. 2007. PMID: 17482317 Free PMC article.
-
Categorising a problem: alcohol and dementia.Acta Neurol Belg. 2021 Feb;121(1):1-10. doi: 10.1007/s13760-020-01515-y. Epub 2020 Oct 14. Acta Neurol Belg. 2021. PMID: 33052532 Review.
References
-
- Ayoub AE, Cai TQ, Kaplan RA, Luo J. Developmental expression of matrix metalloproteinases 2 and 9 and their potential role in the histogenesis of the cerebellar cortex. J Comp Neurol. 2005;481:403–415. - PubMed
-
- Baker KG, Harding AJ, Halliday GM, Kril JJ, Harper CG. Neuronal loss in functional zones of the cerebellum of chronic alcoholics with and without Wernicke's encephalopathy. Neuroscience. 1999;91:429–438. - PubMed
-
- Bettendorff L, Goessens G, Sluse F, Wins P, Bureau M, Laschet J, Grisar T. Thiamine deficiency in cultured neuroblastoma cells: effect on mitochondrial function and peripheral benzodiazepine receptors. J Neurochem. 1995;64:2013–2021. - PubMed
-
- Calingasan NY, Chun WJ, Park LC, Uchida K, Gibson GE. Oxidative stress is associated with region-specific neuronal death during thiamine deficiency. J Neuropathol Exp Neurol. 1999;58:946–958. - PubMed
-
- Calingasan NY, Gibson GE. Vascular endothelium is a site of free radical production and inflammation in areas of neuronal loss in thiamine-deficient brain. Ann NY Acad Sci. 2000;903:353–356. - PubMed
Publication types
MeSH terms
Substances
Grants and funding
LinkOut - more resources
Full Text Sources
Other Literature Sources
Medical
Research Materials
