Review
. 2007 Apr 14;145(4):1341-7.
doi: 10.1016/j.neuroscience.2006.09.060. Epub 2006 Nov 28.

Genome dynamics and transcriptional deregulation in aging

Affiliations
Review

Genome dynamics and transcriptional deregulation in aging

R Busuttil et al. Neuroscience. .

Abstract

Genome instability has been implicated as a major cause of both cancer and aging. Using a lacZ-plasmid transgenic mouse model we have shown that mutations accumulate with age in a tissue-specific manner. Genome rearrangements, including translocations and large deletions, are a major component of the mutation spectrum in some tissues at old age such as heart. Such large mutations were also induced by hydrogen peroxide (H2O2) in lacZ-plasmid mouse embryonic fibroblasts (MEFs) and demonstrated to be replication-independent. This was in contrast to ultraviolet light-induced point mutations, which were much more abundant in proliferating than in quiescent MEFs. To test if large rearrangements could adversely affect patterns of gene expression we PCR-amplified global mRNA content of single MEFs treated with H2O2. Such treatment resulted in a significant increase in cell-to-cell variation in gene expression, which was found to parallel the induction and persistence of genome rearrangement mutations at the lacZ reporter locus. Increased transcriptional noise was also found among single cardiomyocytes from old mice as compared with similar cells from young mice. While these results do not directly indicate a cause and effect relationship between genome rearrangement mutations and transcriptional deregulation, they do underscore the stochastic nature of genotoxic effects on cells and tissues and could provide a mechanism for age-related cellular degeneration in postmitotic tissue, such as heart or brain.


Figures
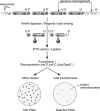
Fig 1
Fig 1
Schematic depiction of the LacZ- plasmid model for mutation analysis. In this system, plasmids are rescued by the excision of genomic DNA with HindIII, followed by their separation from the mouse genomic DNA using magnetic beads, precoated with a lacI repressor protein. The plasmids are then ligated and transferred to Escherichia coli C (ΔlacZ, galE) using electrotransformation. A small amount of transformants is plated in medium with X-gal to determine the total number of plasmids rescued. The remainder is plated on the lactose analogue p-gal, to select only the cells harboring a mutant lacZ gene. The mutant frequency is the ratio of the colonies on the selective plate versus the colonies on the titer plate (times the dilution factor).
Fig 2
Fig 2
Frequencies of point mutations (hatched) and genome rearrangements (solid) in lacZ-MEFs, either irradiated with 2.5 J/m2 UVC radiation or treated with 100 μM H2O2 at 3-days post treatment.
Fig 3
Fig 3
H2O2 treatment of MEFs increases cell-to-cell variation in gene expression. (A) Cell-to-cell variation in relative expression of Actb (normalized over Gapdh) among MEF single-cell equivalents, untreated MEFs and MEFs at 48 h after treatment with 0.1 mM H2O2. The variation among the treated cells is significantly greater than among the untreated cells (P<0.0001). Boxes in the box plots indicate the interquartile range (IQR) with the median; the whiskers indicate1.5x the IQR. (B) Coefficient of variance (CV) calculated for all relative quantities of Actb, B2m and Tuba6 at each time point and treatment condition. The 6 h, 48 h and 9 day time points are based on 2, 4, and 3 independent experiments, respectively. Each experiment consists of 11-15 single cell determinations for each gene under each treatment condition. (C) lacZ mutation frequencies at 6 h, 48 h and 9 days after H2O2 treatment as compared with control populations. Mutation frequencies are averages from three independent determinations from each of two parallel experiments. The subdivision into point mutations (grey bars) and genome rearrangements (black bars) was made on the basis of restriction enzyme analysis of 48 mutants taken from each experiment. Error bars indicate s.d. Reprinted by permission from Macmillan Publishers Ltd: Nature, vol. 441, 1011-1014, copyright 2006. http://www.nature.com/index.html
Fig 3
Fig 3
H2O2 treatment of MEFs increases cell-to-cell variation in gene expression. (A) Cell-to-cell variation in relative expression of Actb (normalized over Gapdh) among MEF single-cell equivalents, untreated MEFs and MEFs at 48 h after treatment with 0.1 mM H2O2. The variation among the treated cells is significantly greater than among the untreated cells (P<0.0001). Boxes in the box plots indicate the interquartile range (IQR) with the median; the whiskers indicate1.5x the IQR. (B) Coefficient of variance (CV) calculated for all relative quantities of Actb, B2m and Tuba6 at each time point and treatment condition. The 6 h, 48 h and 9 day time points are based on 2, 4, and 3 independent experiments, respectively. Each experiment consists of 11-15 single cell determinations for each gene under each treatment condition. (C) lacZ mutation frequencies at 6 h, 48 h and 9 days after H2O2 treatment as compared with control populations. Mutation frequencies are averages from three independent determinations from each of two parallel experiments. The subdivision into point mutations (grey bars) and genome rearrangements (black bars) was made on the basis of restriction enzyme analysis of 48 mutants taken from each experiment. Error bars indicate s.d. Reprinted by permission from Macmillan Publishers Ltd: Nature, vol. 441, 1011-1014, copyright 2006. http://www.nature.com/index.html
Fig 4
Fig 4
Increased cell-to-cell variation in gene expression among cardiomyocytes from the heart of old as compared with young mice. Examples of four genes showing statistically significant cell-to-cell variability in expression (Actb, B2m, Lpl and Actc1; normalized over Gapdh) (p<0.0001 for all genes). Boxes in the box plots indicate the interquartile range (IQR) with the median; the whiskers indicate1.5x the IQR. Reprinted by permission from Macmillan Publishers Ltd: Nature, vol. 441, 1011-1014, copyright 2006. http://www.nature.com/index.html

References

    1. Bahar R, Hartmann CH, Rodriguez KA, Denny AD, Busuttil RA, Dolle ME, Calder RB, Chisholm GB, Pollock BH, Klein CA, Vijg J. Increased cell-to-cell variation in gene expression in ageing mouse heart. Nature. 2006;441:1011–1014. - PubMed
    1. Bailey KJ, Maslov AY, Pruitt SC. Accumulation of mutations and somatic selection in aging neural stem/progenitor cells. Aging Cell. 2004;3:391–397. - PubMed
    1. Becskei A, Kaufmann BB, van Oudenaarden A. Contributions of low molecule number and chromosomal positioning to stochastic gene expression. Nat Genet. 2005;37:937–944. - PubMed
    1. Boerrigter ME, Dolle ME, Martus HJ, Gossen JA, Vijg J. Plasmid-based transgenic mouse model for studying in vivo mutations. Nature. 1995;377:657–659. - PubMed
    1. Busuttil RA, Garcia AM, Cabrera C, Rodriguez A, Suh Y, Kim WH, Huang TT, Vijg J. Organ-specific increase in mutation accumulation and apoptosis rate in CuZn-superoxide dismutase-deficient mice. Cancer Res. 2005;65:11271–11275. - PubMed