. 2007 Feb 15;579(Pt 1):147-60.
doi: 10.1113/jphysiol.2006.124222. Epub 2006 Nov 30.

Window Ca2+ current and its modulation by Ca2+ release in hypertrophied cardiac myocytes from dogs with chronic atrioventricular block

Affiliations

Window Ca2+ current and its modulation by Ca2+ release in hypertrophied cardiac myocytes from dogs with chronic atrioventricular block

Gudrun Antoons et al. J Physiol. .

Abstract

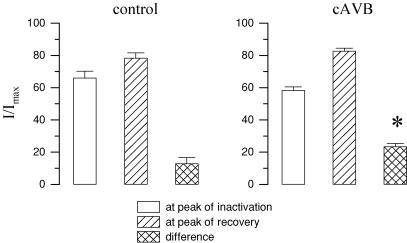
Torsades de pointes (TdP) ventricular tachycardia typically occurs in the setting of early afterdepolarizations; it contributes to arrhythmias and sudden death in congenital and acquired heart disease. Window L-type Ca2+ current (ICaL) has a central role in the arrhythmogenesis and may be particularly important under beta-adrenergic stimulation. We studied the properties of ICaL in myocytes from the dog with chronic atrioventricular block (cAVB) that has cardiac hypertrophy and an increased susceptibility to TdP. Peak ICaL densities at baseline (K+ - and Na+ -free solutions, 10 mmol l(-1) [EGTA]pip) in cAVB were comparable to control, but inactivation was shifted to the right, resulting in a larger window current area in cAVB. Under beta-adrenergic stimulation, the window current area was increased and shifted to the left, but less so in cAVB (maximum at -27 mV, versus -32 mV in control). ICaL during a step to -35 mV showed a transient reduction immediately after the peak. Test steps to 0 mV, simultaneous recording of [Ca2+]i and manipulation of sarcoplasmic reticulum (SR) Ca2+ release showed that this resulted from inhibition and fast recovery of ICaL with SR Ca2+ release. The extent of this dynamic modulation was larger in cAVB than in control (23 +/- 2% of the initially available current, versus 13 +/- 3%; P<0.05). Early afterdepolarizations (EADs) in cAVB myocytes under beta-adrenergic stimulation typically occurred in the window current voltage range and after decline of [Ca2+]i. In conclusion, in cAVB, the larger window current, its rightward shift and enhanced dynamic modulation by SR Ca2+ release may contribute to an increased incidence of EADs in cAVB under beta-adrenergic stimulation.


Figures

Figure 1
Figure 1. Amplitude of Ca2+ currents
A, voltage protocol to measure peak inward Ca2+ current from −40 and from −80 mV in a single recording. B, mean data for peak inward currents from 16 LV cells from 6 chronic AVB dogs and 15 LV cells from 5 control dogs, from both −40 and −80 mV holding potential. The current at the end of the pulse was the same regardless of the holding potential and is shown for a holding voltage of −40 mV. C, combined activation and inactivation curves; V½ of inactivation was −22 ± 2 mV and −27 ± 1 mV in cAVB versus control (P < 0.05), where k was 4.5 ± 0.3 mV in cAVB and 4.8 ± 0.3 mV in control (P = NS). For activation, V½ =−8 ± 2 mV, k = 4.5 ± 0.3 mV in cAVB; V½ = − 10 ± 1 mV, k = 4.9 ± 0.4 mV in control cells (P = NS).
Figure 2
Figure 2. Time course of inactivation of the Ca2+ current at baseline
The current during a 300 ms step to +10 mV was fitted with two exponentials. The means for time constants are from 13 cells in each group.
Figure 3
Figure 3. β-Adrenergic stimulation of Ca2+ current
A, dose–response for isoproterenol, of the peak inward current at +10 mV. The maximal response of the normalized current, I/I0, was 3.34 ± 1.18 and 3.47 ± 0.31, with EC50 of 94 ± 13 nm and 128 ± 38 nm in cAVB versus control (P = NS). The Hill coefficient was 1.42 ± 0.16 in cAVB and 1.38 ± 0.13 in control (P = NS). These parameters were calculated and averaged from individual fitting of data from 8 cAVB and 10 control cells. B, example of the wash-in of 3 μmol l−1 isoproterenol, illustrating the induction of inward current at −40 and −35 mV (arrows). C, nifedipine (blue trace) blocks all current from the holding voltage of −40 mV, but from the holding voltage of −80 mV residual current can be seen for the step to −20 mV. This residual current could be blocked with 200 μm Cd2+.
Figure 4
Figure 4. Current–voltage relation and inactivation under β-adrenergic stimulation
A, full I–V curves from holding potential of −80 and −40 mV, mean data for 12 cAVB cells and 10 control cells. B, pooled data for steady-state inactivation and activation illustrating the window current range; V½ values were (in cAVB versus control): for inactivation, −30 ± 1 versus−35 ± 1 mV; for activation, −25 ± 1 versus−30 ± 1 mV (both P < 0.05). Slope was k = 4.3 ± 0.4 versus 4.4 ± 0.1 for inactivation; k = 3.9 ± 0.4 versus 3.3 ± 0.2 for activation (cAVB versus control, P = NS). The inset is an enlargement of the window area.
Figure 5
Figure 5. Window currents under β-adrenergic stimulation
A, illustration of the window current at −35 mV. The current at the end of a 1.5 s depolarizing step is independent of the preceding voltage: for a negative conditioning pulse one can see activation and partial inactivation (blue trace, −80 mV), whereas for a positive conditioning step there is recovery from inactivation (black trace, 0 mV). B, window current (upper panel) and Ca2+ influx measured with Fluo-3 (lower panel), in a cell dialysed without EGTA. C, the window current (upper panel) and [Ca2+]i (lower panel) measured during a 18 s step at −35 mV following a pulse to −10 mV at baseline (black traces); during the next sweep, 200 μm Cd2+ applied for 5 s transiently blocked the persistent inward current and Ca2+ influx, with full recovery on washout (red traces). [Ca2+]i was measured using Indo-1.
Figure 6
Figure 6. Time course of inactivation and recovery during a single depolarizing step
A, left panels, the ‘notch’ on the current during a step to −35 mV is reflected in the availability of L-type Ca2+ channels, as tested during a further depolarizing step to 0 mV. A spike of fluorescence was also recorded. However this was not present at baseline in the absence of isoproterenol (right panel). B, after addition of caffeine to suppress sarcoplasmic reticulum (SR) Ca2+ release and uptake, the notch disappeared and one saw only monotonous inactivation during the step, reflected also in the time course of the peak current for steps to 0 mV. C, comparison of the time course of the window current and the peak inward current at 0 mV: left panel, measured data points; middle panel, values after normalization to the maximal peak inward current; right panel, correlation analysis and regression (r = 0.96, P < 0.001, slope 1.18).
Figure 7
Figure 7. Dynamic modulation of the L-type Ca2+ current is larger in cAVB
The extent of this modulation was quantified by measuring the ratio between the maximal current at 0 mV, Imax, and the minimal current at 25 or 50 ms, i.e. inactivation, and between Imax and the subsequent maximal current, i.e. recovery. Inactivation tended to be larger in cAVB as did the recovery, such that the extent of modulation, i.e. the difference between inactivation and recovery was significantly larger in cAVB than in control myocytes (n = 9 for control and 10 for cAVB).
Figure 8
Figure 8. Dynamic modulation in the absence of [Ca2+]i buffering
A, example of simultaneous recording of membrane currents and [Ca2+]i. The trace labelled ‘a’ is the step from −80 to −35 mV; ‘b’ and ‘c’ are the test steps to 0 mV at 0 and 20 ms. B, pooled data of 5 control and 4 cAVB myocytes for the extent of inactivation, recovery and modulation, see legend to Fig. 7.
Figure 9
Figure 9. Early afterdepolarization and [Ca2+]i
Example of action potentials and [Ca2+]i transients recorded in a cAVB myocyte in the presence of 1 μmol l−1 isoproterenol. The early afterdepolarization (EAD) is accompanied by an increase of [Ca2+]i that is, however, small compared with the [Ca2+]i transients that arise spontaneously at the resting membrane potential 3 s later. Just before the last stimulated action potential, a spontaneous release occurs, with a small depolarization, reducing the triggered Ca2+ release.

References

    1. Adachi Akahane S, Cleemann L, Morad M. Cross-signaling between L-type Ca2+ channels and ryanodine receptors in rat ventricular myocytes. J Gen Physiol. 1996;108:435–454. - PMC - PubMed
    1. Antzelevitch C, Shimizu W. Cellular mechanisms underlying the long QT syndrome. Curr Opin Cardiol. 2002;17:43–51. - PubMed
    1. Balke CW, Shorofsky S. Alterations in calcium handling in cardiac hypertrophy and heart failure. Cardiovasc Res. 1998;37:290–299. - PubMed
    1. Boutjdir M, Restivo M, Wei Y, Stergiopoulos K, el Sherif N. Early afterdepolarization formation in cardiac myocytes: analysis of phase plane patterns, action potential, and membrane currents. J Cardiovasc Electrophysiol. 1994;5:609–620. - PubMed
    1. Chen X, Piacentino V, Furukawa S, Goldman B, Margulies KB, Houser SR. L-type Ca2+ channel density and regulation are altered in failing human ventricular myocytes and recover after support with mechanical assist devices. Circ Res. 2002;91:517–524. - PubMed

Publication types

MeSH terms