. 2006 Dec;47(12):2016-24.

Radioimaging of light chain amyloid with a fibril-reactive monoclonal antibody

Affiliations

Radioimaging of light chain amyloid with a fibril-reactive monoclonal antibody

Jonathan S Wall et al. J Nucl Med. 2006 Dec.

Abstract

Currently, there are no available means in the United States to document objectively the location and extent of amyloid deposits in patients with systemic forms of amyloidosis. To address this limitation, we have developed a novel diagnostic strategy, namely, the use of a radiolabeled fibril-reactive murine monoclonal antibody (mAb) as an amyloid-specific imaging agent. The goal of this study was to determine the pharmacokinetics, biodistribution, and ability of this reagent to target the type of amyloid that is formed from immunoglobulin light chains, that is, AL.

Methods: Subcutaneous tumors (amyloidomas) were induced in BALB/c mice by injection of human AL fibrils. The IgG1 mAb designated 11-1F4 and an isotype-matched control antibody were radioiodinated, and the pharmacokinetics and localization of these reagents were determined from blood and tissue samples. Amyloidoma-bearing animals that received (125)I- or (124)I-labeled antibodies were imaged by whole-body small-animal SPECT/CT or small-animal PET/CT technology, respectively.

Results: Radioiodinated mAb 11-1F4 retained immunoreactivity, as evidenced by its subnanomolar affinity for light chains immobilized on 96-well microtiter plates and for beads conjugated with a light chain-related peptide. Additionally, after intravenous administration, the labeled reagents had the expected biologic half-life of murine IgG1, with monoexponential whole-body clearance kinetics. In the amyloidoma mouse model, (125)I-11-1F4 was predominately localized in the tumors, as demonstrated in biodistribution and autoradiographic analyses. The mean uptake of this reagent, that is, the percentage injected dose per gram of tissue, 72 h after injection was significantly higher for amyloid than for skeletal muscle, spleen, kidney, heart, liver, or other tissue samples. Notably, the accumulation within the amyloidomas of (125)I- or (124)I-11-1F4 was readily visible in the fused small-animal SPECT/CT or small-animal PET/CT images, respectively.

Conclusion: Our studies demonstrate the amyloid-imaging capability of a radiolabeled fibril-reactive mAb and provide the basis for a clinical trial designed to determine its diagnostic potential in patients with AL amyloidosis and other systemic amyloidoses.


Figures
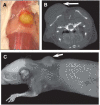
FIGURE 1
FIGURE 1
Murine model of an AL amyloidoma. (A) Gross appearance of vascularized amyloidoma. (B) Axial slice through upper abdomen of mouse 7 d after 50-mg amyloidoma induction and after administration of an intravenous dose of contrast medium 30 min before image acquisition. (C) Three-dimensional volumetric rendering. Arrows indicate location of amyloidoma. Tumor volume was calculated from small-animal CT data to be 104 mm3.
FIGURE 2
FIGURE 2
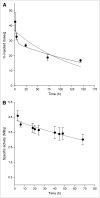
Pharmacokinetics of radioiodinated mAb 11-1F4. Plasma (A) and whole-body (B) clearance kinetics for 125I- and 124I-labeled mAb 11-1F4, respectively, injected into normal mice (6 and 3 animals at each time point for 125I and 124I studies, respectively). Mono- and biexponential fits to data are represented by dashed and solid lines, respectively. No convergence was achieved with biexponential equation for data in B.
FIGURE 3
FIGURE 3
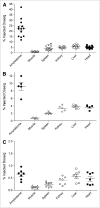
Biodistribution of radiolabeled mAb 11-1F4. (A and B) Comparison of amyloidoma vs. tissue uptake 72 h after injection of 125I-11-1F4 in mice bearing ALκ (A) or ALλ (B) amyloidomas. (C) Data for 125I-MOPC-31C (control antibody) given to mice with ALκ amyloidomas. Bars indicate mean ± SD. Note different scales on ordinates.
FIGURE 4
FIGURE 4
Autoradiographic localization within human AL amyloidomas of radioiodinated mAb 11-1F4. ALκ and ALλ amyloidoma–bearing mice were injected 7 d after induction with either 125I-labeled fibril-reactive (11-1F4) or control (MOPC-31C) antibody, and tumors were harvested 72 h later. (Top row) Congo red–stained sections (polarizing microscopy; original magnification, ×80). (Bottom row) Microautoradiographs (exposure, 72 h∼ original magnification, ×80). %ID/g values for 125I-11-1F4 in ALκ and ALλ tumors were 43 and 9, respectively.
FIGURE 5
FIGURE 5
Radioimaging of human AL amyloidomas by small-animal SPECT/CT. Amyloid-bearing mice were injected with 125I-11-1F4 antibody (A, B, E, F, and G) or control MOPC-31C antibody (C, D, and H) and scanned 72 h later. (A and C) Left lateral SPECT/CT images of 125I-11-1F4 and 125I-MOPC-31C, respectively, in ALκ amyloidoma–bearing mouse (threshold for SPECT, 10% maximum value). (B and D) Dorsal–ventral SPECT/CT images of 125I-11-1F4 and 125I-MOPC-31C, respectively, in ALκ amyloidoma–bearing mouse (threshold for SPECT, 10% maximum value; arrow indicates amyloidoma visible in CT image only). (E) Intensity of 125I activity along sagittal plane bisecting amyloidoma (line and shaded area coincide with 60% maximum-intensity threshold for SPECT applied to F, G, and H; 1, 2, 3, and 4 indicate tongue, thyroid, liver, and amyloidoma, respectively). (F and G) Representative images of 125I-11-1F4–injected mice bearing ALκ (F) and ALλ (G) amyloidomas; thresholded SPECT is shown as isosurface. (H) Image of mouse with induced ALκ amyloidoma that received control 125I-MOPC-31C antibody (isosurface rendering). Volumes of amyloidomas in mice shown in A, B, and F; in C, D, and H; in E; and in G were 260, 130, 120, and 196 mm3, respectively.
FIGURE 6
FIGURE 6
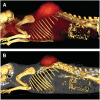
Radioimaging of human amyloid by small-animal PET/CT. Volume-rendered, coregistered PET/CT images are shown for an AL amyloidoma–bearing mouse injected with 124I-11-1F4 and scanned 72 h later. (A) Coregistered small-animal CT and small-animal PET (threshold of 10% maximum intensity for PET). (B) Small-animal PET/CT image (PET data threshold at ≥60% maximum intensity).

References

    1. Aprile C, Marinone G, Saponaro R, Bonino C, Merlini G. Cardiac and pleuropulmonary AL amyloid imaging with technetium-99m labelled aprotinin. Eur J Nucl Med. 1995;22:1393–1401. - PubMed
    1. Hachulla E, Maulin L, Deveaux M, et al. Prospective and serial study of primary amyloidosis with serum amyloid P component scintigraphy: from diagnosis to prognosis. Am J Med. 1996;101:77–87. - PubMed
    1. Hawkins PN, Lavender JP, Pepys MB. Evaluation of systemic amyloidosis by scintigraphy with 123I-labeled serum amyloid P component. N Engl J Med. 1990;323:508–513. - PubMed
    1. Schaadt BK, Hendel HW, Gimsing P, Jonsson V, Pedersen H, Hesse B. 99mTc-Aprotinin scintigraphy in amyloidosis. J Nucl Med. 2003;44:177–183. - PubMed
    1. Hrncic R, Wall J, Wolfenbarger DA, et al. Antibody-mediated resolution of light chain-associated amyloid deposits. Am J Pathol. 2000;157:1239–1246. - PMC - PubMed

Publication types