. 2006 Dec 13;25(24):5648-58.
doi: 10.1038/sj.emboj.7601462. Epub 2006 Nov 30.

GLUT4 is internalized by a cholesterol-dependent nystatin-sensitive mechanism inhibited by insulin

Affiliations

GLUT4 is internalized by a cholesterol-dependent nystatin-sensitive mechanism inhibited by insulin

Vincent Blot et al. EMBO J. .

Abstract

Insulin slows GLUT4 internalization by an unknown mechanism. Here we show that in unstimulated adipocytes, GLUT4 is internalized by two mechanisms. Approximately 80% of GLUT4 is internalized by a mechanism that is sensitive to the cholesterol-aggregating drug nystatin, and is independent of AP-2 clathrin adaptor and two putative GLUT4 endocytic motifs. The remaining GLUT4 is internalized by an AP-2-dependent, nystatin-resistant pathway that requires the FQQI GLUT4 motif. Insulin inhibits GLUT4 uptake by the nystatin-sensitive pathway and, consequently, GLUT4 is internalized by the AP-2-dependent pathway in stimulated adipocytes. The phenylalanine-based FQQI GLUT4 motif promotes AP-2-dependent internalization less rapidly than a tyrosine-based motif, the classic form of aromatic-based motifs. Thus, both a change in the predominant endocytosis pathway and the specific use of a suboptimal internalization motif contribute to the slowing of GLUT4 internalization in insulin-stimulated adipocytes. Insulin also inhibits the uptake of cholera-toxin B, indicating that insulin broadly regulates cholesterol-dependent uptake mechanisms rather than specially targeting GLUT4. Our work thus identifies cholesterol-dependent uptake as a novel target of insulin action in adipocytes.


Figures
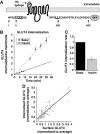
Figure 1
Figure 1
Insulin inhibits GLUT4 endocytosis. (A) Schematic representation of the HA-GLUT4-GFP reporter. The F5QQI and LL490 motifs are noted. The positions of the amino acids from the amino terminus are shown. (B) Representative experiment determining GLUT4 internalization rate constant in adipocytes. Internalization of HA-GLUT4-GFP in insulin-stimulated or basal adipocytes was measured by determining the ratio of HA.11 anti-HA antibody internalized normalized to the amount of HA.11 on the plasma membrane. The slope of the plot of the internal-to-plasma membrane ratio versus time is the internalization rate constant. The values are the mean±s.e.m. determined from at least 20 cells per time point. Different time courses for measurement of GLUT4 internalization in the basal and insulin-stimulated conditions are discussed as Supplementary data. (C) Insulin inhibits GLUT4 endocytosis. Results are the mean±s.d. deviation of 10 independent experiments measuring GLUT4 internalization in basal and insulin-stimulated conditions. The data were normalized to the basal rate of each experiment. (D) Elevated level of GLUT4 in the plasma membrane of insulin-stimulated adipocytes does not saturate GLUT4 uptake mechanism. Results are cell-by-cell analysis from the 9 min time point of five independent GLUT4 internalization assays in insulin-stimulated adipocytes. Within each experiment, surface GLUT4 and the corresponding internalized GLUT4 are normalized to the average values.
Figure 2
Figure 2
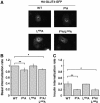
GLUT4 follows two different internalization pathways in the basal and insulin-stimulated state. (A) GLUT4 mutant localizations. Localization of different HA-GLUT4-GFP constructs expressed in adipocytes and detected by GFP fluorescence in epifluorescence microscopy. (B, C). GLUT4 internalization in basal adipocytes (B) and insulin-stimulated adipocytes (C). The results are the mean±s.d. of at least three independent experiments. The data were normalized to the basal rate of wild-type HA-GLUT4-GFP measured in each experiment. *P<0.05, **P<0.01; Student's t-test probabilities.
Figure 3
Figure 3
AP-2 clathrin adaptor knockdown in 3T3-L1 adipocytes. (A) AP-2 knockdown in adipocytes. Adipocytes were electroporated with HA-GLUT4-GFP or the human TR plasmid alone (control) or together with the pSUPER μ2 plasmid encoding an shRNA to the AP-2 μ2 chain. Forty-eight hours after electroporation, cells were fixed and stained for AP-2. Images are representative of three independent experiments and have been equally scaled so that pixels intensities can be directly compared. (B) Quantification of AP-2 knockdown. For both control and pSUPER μ2 conditions, AP-2 α chain fluorescence was quantified for greater than 200 cells identified as positive for transfection based on either HA-GLUT4-GFP or human TR expression. Results are pooled data from five independent experiments. Within each experiment, AP-2 α chain fluorescence was normalized to the average value obtained for control cells. (C) Effect of AP-2 knockdown on TR endocytosis. Basal TR internalization rate was measured in control and in pSUPER μ2 electroporated adipocytes. Results are mean with s.d. of two independent experiments. (D) Remaining TR endocytosis is associated with incomplete AP-2 knockdown. Plot of 9 min transferrin uptake versus AP-2 fluorescence in adipocytes electroporated with TR alone (control) or TR and pSUPER μ2. Results are pooled data from three independent experiments. Within each experiment, AP-2 α chain fluorescence was normalized to the average value obtained for control cells. The dashed line shows the correlation between the amount of transferrin uptake and the remaining AP-2 fluorescence in pSUPER μ2 electroporated cells.
Figure 4
Figure 4
GLUT4 internalization is AP-2-independent at basal and becomes AP-2-dependent after insulin stimulation. GLUT4 internalization was measured in control and in AP-2 knockdown cells in both (A) the basal and (B) the insulin-stimulated states. Results are the mean±s.d. of three independent experiments.
Figure 5
Figure 5
GLUT4 colocalizes with AP-2 and internalized transferrin in endocytic vesicles only in the insulin-stimulated state. GFP images were collected in the green channel in the total TIRF mode and the Cy-3 channel in the epifluorescence mode (Epi). (A) Colocalization between HA-GLUT4-GFP in the TIRF zone and HA.11 anti-HA internalized for 10 min to label HA-GLUT4-GFP-containing endosomes. (B) Colocalization between HA-GLUT4-GFP in the TIRF zone and AP-2 clathrin adaptor. (C) Colocalization between HA-GLUT4-GFP and Alexa546-conjugated transferrin internalized for 10 min. Overlays of green TIRF images and red epifluorescence images are shown (overlay). Images are representative of results from three independent experiments, and have been scaled by eye, and as a consequence, absolute pixel intensities between different panels cannot be compared.
Figure 6
Figure 6
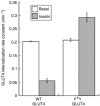
GLUT4 is predominantly internalized by a nystatin-sensitive mechanism is basal adipocytes. (A) TR clathrin-dependent internalization is resistant to nystatin. Cells were treated for 1 h with 50 μg/ml nystatin or not treated (control) before the assay. The results are the mean±s.d. from two independent experiments. The data were normalized to the control rate of each experiment. ns, not statistically significant. (B) Basal GLUT4 internalization is sensitive to nystatin whereas GLUT4 internalization upon insulin stimulation is resistant to nystatin. Cells were maintained in basal conditions or stimulated with 170 nM insulin for 30 min before addition of 50 μg/ml nystatin for 1 h. No nystatin was added to the control cells. The results are the mean±s.d. from two independent experiments. The data were normalized to the control rate of wild-type GLUT4 of each experiment. (C) Nystatin and mutation of F5A GLUT4 together completely inhibit basal GLUT4 internalization. Cells expressing wild-type GLUT4 or F5A-GLUT4 were treated for 1 h with 50 μg/ml nystatin and GLUT4 internalization was measured. The data are the averages±s.d. from two experiments.
Figure 7
Figure 7
Insulin accelerates the nystatin-resistant uptake and inhibits the nystatin-sensitive uptake. (A) Insulin inhibits CT-B uptake. Results are the mean±s.d. from two independent experiments (basal and insulin) or from one experiment with s.e.m. (nystatin). Within each experiment, the amount of CT-B taken up for 30 min was quantified for greater than 200 cells and normalized to the amount of CT-B bound to the plasma membrane at time 0. (B) Insulin increases TR internalization. The results are the mean±s.d. from three independent experiments. The data were normalized to the basal rate of each experiment.
Figure 8
Figure 8
The suboptimal F5QQI endocytic signal is responsible for slow GLUT4 internalization in insulin-stimulated adipocytes. The endocytosis rate constants of wild type and F5Y GLUT4 in basal and insulin-stimulated adipocytes are shown. The data are the means±s.d. from three independent experiments.
Figure 9
Figure 9
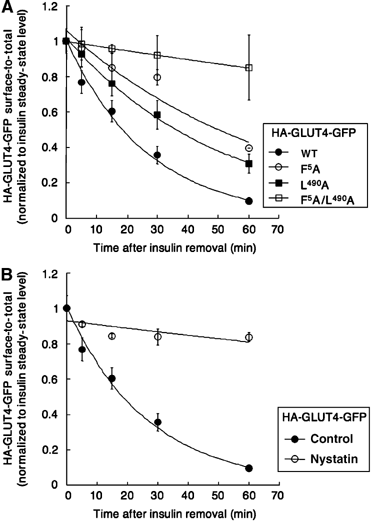
GLUT4 return-to-basal level after insulin withdrawal is a complex process involving the F5QQI and LL490 motifs as well as nystatin-sensitive pathways. Adipocytes were stimulated with insulin, the insulin removed and cells were fixed after different recovery times. The ratio of surface GLUT4 to total GLUT4 for each time point was fit to a single exponential decrease described by the following equation: Abasal−(Ainsulin × exp(−Kreturnt)), where A represents the fraction of GLUT4 at the cell surface at either the basal (Abasal) or the insulin-stimulated (Ainsulin) state, t is the time and Kreturn is the rate of return to the GLUT4 basal surface level. (A) The F5QQI and LL490 motifs are important for GLUT4 return-to-basal retention. The results are the mean±s.d. from two (F5A, F5A/L490A) or three (wild type and L490A) independent experiments. Rates of GLUT4 return-to-basal level extracted from these plots are as follows: wild type: 0.04 min−1; F5A: 0.02 min−1; L490A: 0.02 min−1 and F5A/L490A: 0.003 min−1. (B) Nystatin-sensitive pathways are implicated is GLUT4 return-to-basal. After 30 min insulin pre-stimulation, 50 μg/ml nystatin was added for another 60 min before insulin removal. Nystatin was present during recovery time. The results are the mean±s.d. from two (nystatin) or three (control) independent experiments. Rates of GLUT4 return-to-basal level extracted from these plots are as follows: control: 0.04 min−1; nystatin: 0.002 min−1.
Figure 10
Figure 10
Model for regulation of GLUT4 internalization. See text for discussion.

References

    1. Al-Hasani H, Kunamneni RK, Dawson K, Hinck CS, Muller-Wieland D, Cushman SW (2002) Roles of the N- and C-termini of GLUT4 in endocytosis. J Cell Sci 115: 131–140 - PubMed
    1. Araki S, Yang J, Hashiramoto M, Tamori Y, Kasuga M, Holman GD (1996) Subcellular trafficking kinetics of GLU4 mutated at the N- and C-terminal. Biochem J 315: 153–159 - PMC - PubMed
    1. Bonifacino JS, Traub LM (2003) Signals for sorting of transmembrane proteins to endosomes and lysosomes. Annu Rev Biochem 72: 395–447 - PubMed
    1. Choudhury A, Marks DL, Proctor KM, Gould GW, Pagano RE (2006) Regulation of caveolar endocytosis by syntaxin 6-dependent delivery of membrane components to the cell surface. Nat Cell Biol 8: 317–328 - PubMed
    1. Corvera S, Chawla A, Chakrabarti R, Joly M, Buxton J, Czech MP (1994) A double leucine within the GLUT4 glucose transporter COOH-terminal domain functions as an endocytosis signal. J Cell Biol 126: 1625. - PMC - PubMed

Publication types

MeSH terms