. 2007 Mar 1;92(5):1573-84.
doi: 10.1529/biophysj.106.097568. Epub 2006 Dec 1.

Three-dimensional dynamic structure of the liquid-ordered domain in lipid membranes as examined by pulse-EPR oxygen probing

Affiliations

Three-dimensional dynamic structure of the liquid-ordered domain in lipid membranes as examined by pulse-EPR oxygen probing

Witold K Subczynski et al. Biophys J. .

Abstract

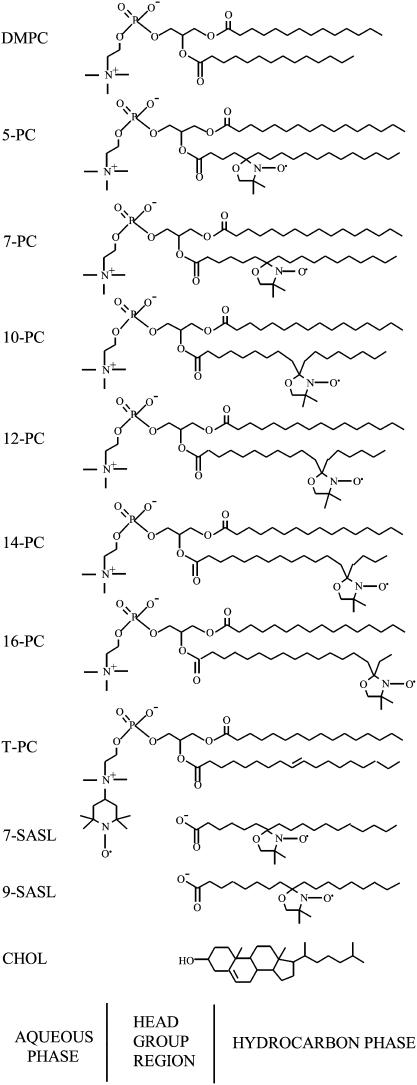
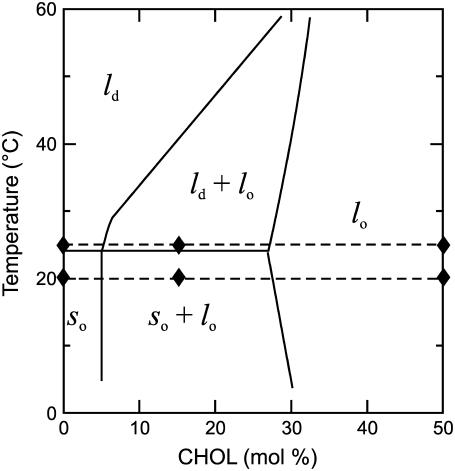
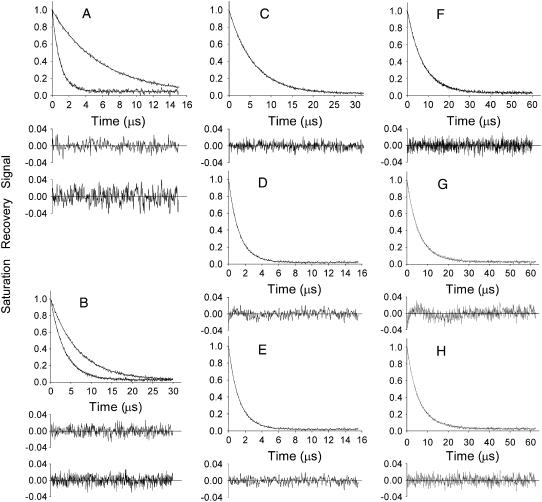
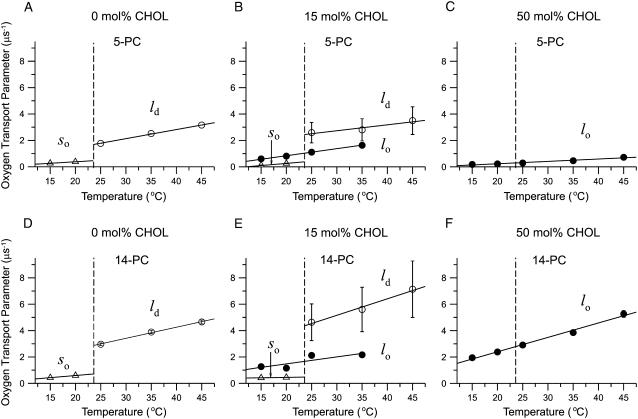
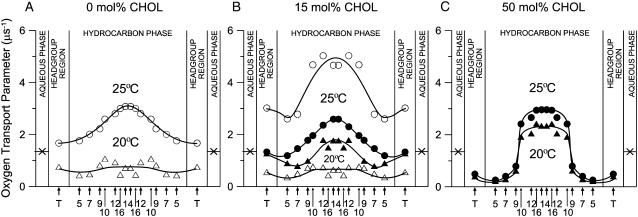
Membranes made of dimyristoylphosphatidylcholine and cholesterol, one of the simplest paradigms for the study of liquid ordered-disordered phase separation, were investigated using a pulse-EPR spin-labeling method in which bimolecular collision of molecular oxygen with the nitroxide spin label is measured. This method allowed discrimination of liquid-ordered, liquid-disordered, and solid-ordered domains because the collision rates (OTP) differ in these domains. Furthermore, the oxygen transport parameter (OTP) profile across the bilayer provides unique information about the three-dimensional dynamic organization of the membrane domains. First, the OTP in the bilayer center in the liquid-ordered domain was comparable to that in the liquid-disordered domain without cholesterol, but the OTP near the membrane surface (up to carbon 9) was substantially smaller in the ordered domain, i.e., the cholesterol-based liquid-ordered domain is ordered only near the membrane surface, still retaining high levels of disorder in the bilayer center. This property may facilitate lateral mobility in ordered domains. Second, in the liquid-disordered domain, the domains with approximately 5 mol % cholesterol exhibited higher OTP than those without cholesterol, everywhere across the membrane. Third, the transmembrane OTP profile in the liquid-ordered domain that contained 50 mol % cholesterol dramatically differed from that which contained 27 mol % cholesterol.


Figures

FIGURE 1
FIGURE 1
Chemical structures of phospholipid-type spin labels, including n-PCs, T-PC, and n-SASLs. Chemical structures of DMPC and cholesterol are included to illustrate approximate locations of nitroxide moieties across the membrane. In the fluid phase, alkyl chains tend to have many gauche conformations, and chain length projected to the membrane normal would be shorter than that depicted here.
FIGURE 2
FIGURE 2
The phase diagram of the DMPC/cholesterol membrane, adapted from Almeida et al. (45). The broken lines indicate the DMPC/cholesterol mixtures and temperatures mainly addressed in the present work. Solid diamonds indicate lipid compositions and temperatures for which OTP profiles presented in Fig. 7 were obtained.
FIGURE 3
FIGURE 3
Representative saturation-recovery signals with fitted curves and the residuals (the experimental signal minus the fitted curve) of 5-PC in DMPC-cholesterol bilayers, obtained at 25°C (A–E) and 20°C (F–H). The membrane specimens were equilibrated with nitrogen (A top, B top, C, F) or the mixture of 50% air and 50% nitrogen (A bottom, B bottom, D, E, G, H). The overall cholesterol content (the mixing ratio) in the membrane was 0 (A), 50 (B), and 15 (C–H) mol %. Experimental data were fitted either to single exponentials with time constants of 5.73 μs (A top), 0.93 μs (A bottom), 6.72 μs (B top), 3.42 μs (B bottom), 5.82 μs (C), 1.27 μs (D), 2.40 μs (F), and 3.87 μs (G), or double exponentials with time constants of 1.38 μs and 0.61 μs (E), 3.84 μs and 1.93 μs (H). For 15 mol % overall cholesterol in the presence of oxygen, the search to fit to a single exponential function was unsatisfactory (D and G, see the residuals), requiring a double-exponential fitting (E and H). The double-exponential fit is consistent with the presence of two immiscible phases (domains) with different oxygen transport rates.
FIGURE 4
FIGURE 4
formula image for 5-PC in various domains of DMPC/cholesterol membranes at 25°C, plotted as a function of the fraction of air in the equilibrating gas mixture. DMPC membranes with no cholesterol (×, ld phase), 15 mol % overall cholesterol (solid circle, lo phase; open circle, ld phase), and 50 mol % overall cholesterol (open triangle, lo phase). The error bars represent the maximal deviations (see the Saturation recovery EPR subsection in the Materials and Methods section).
FIGURE 5
FIGURE 5
OTPs obtained with 5- and 14-PC in DMPC/cholesterol membranes containing 0, 15, and 50 mol % overall cholesterol, plotted as a function of temperature. The vertical dashed line at 23.6°C shows the phase transition temperature of the pure DMPC bilayer. Two OTPs obtained for the membranes containing 15 mol % overall cholesterol represent those for lo (solid circle) and so (open triangle) phases below the phase-transition temperature and lo (solid circle) and ld (open circle) phases above the phase-transition temperature (also indicated in the figure). The error bars represent the maximal deviation (see the Saturation recovery EPR subsection in the Materials and Methods section).
FIGURE 6
FIGURE 6
OTPs plotted as a function of the overall cholesterol content (mixing ratio). Data were obtained at 20°C (open triangle, so phase; solid triangle, lo phase) and 25°C (open circle, ld phase; solid circle, lo phase) with 5-PC (top) and 14-PC (bottom). The error bars represent the maximal deviation (see the Saturation recovery EPR subsection in the Materials and Methods section).
FIGURE 7
FIGURE 7
Profiles of OTP (oxygen diffusion-concentration product) across DMPC-cholesterol bilayers. The parameters for the lo domains are shown by solid keys, and those for ld and so domains are shown in open keys. (A) 0 mol % cholesterol: (open circle) ld domains at 25°C, (open triangle) so domains at 20°C. (B) 15 mol % overall cholesterol: (open circle) ld domain at 25°C, (solid circle) lo domain at 25°C, (solid triangle) lo domain at 20°C, (open triangle) so domain at 20°C. (C) 50 mol % overall cholesterol: (solid circle) lo domain at 25°C, (solid triangle) lo domain at 20°C. Arrows indicate approximate locations of nitroxide moieties of spin labels. T indicates T-PC. The symbol × indicates OTP in the aqueous phase (35). It does not change significantly because the temperature dependences of oxygen diffusion and concentration are opposite. Values of OTPs obtained with n-PC and n-SASL with the same n are practically the same. Lipid compositions and temperatures for which these profiles were obtained are indicated in the phase diagram presented in Fig. 2 as solid diamonds.

References

    1. Simons, K., and E. Ikonen. 1997. Functional rafts in cell membranes. Nature. 387:569–572. - PubMed
    1. Zurzolo, C., G. van Meer, and S. Mayor. 2003. The order of rafts. EMBO Rep. 4:1117–1121. - PMC - PubMed
    1. Subczynski, W. K., and A. Kusumi. 2003. Dynamics of raft molecules in the cell and artificial membranes: approach by pulse EPR spin labeling and single molecule optical microscopy. Biochim. Biophys. Acta. 1610:231–243. - PubMed
    1. Mayor, S., and M. Rao. 2004. Rafts, scale dependent, active lipid organization at the cell surface. Traffic. 5:231–240. - PubMed
    1. Mukherjee, S., and F. R. Maxfield. 2004. Membrane domains. Annu. Rev. Cell Dev. Biol. 20:839–866. - PubMed

Publication types