. 2007 Mar 1;92(5):1486-502.
doi: 10.1529/biophysj.106.096024. Epub 2006 Dec 1.

Energy landscape and transition state of protein-protein association

Affiliations

Energy landscape and transition state of protein-protein association

Ramzi Alsallaq et al. Biophys J. .

Abstract

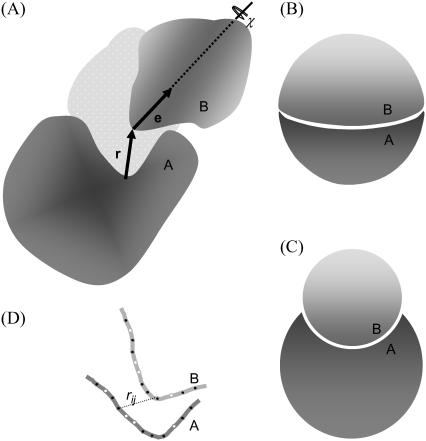
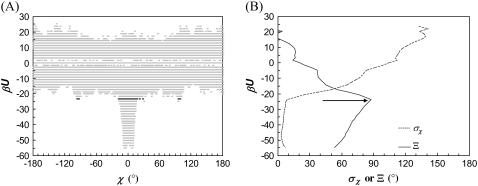
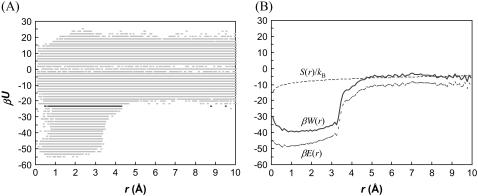
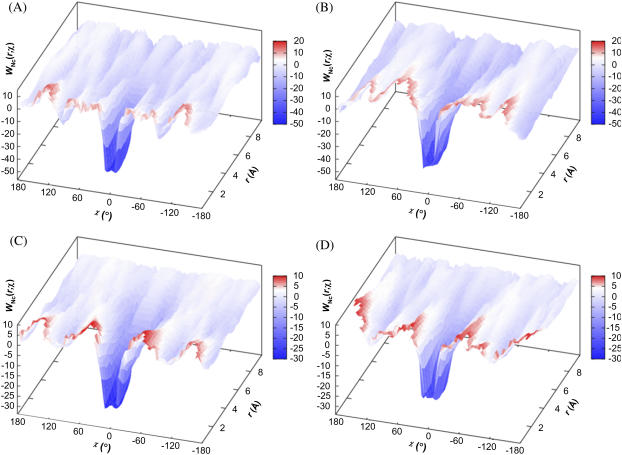
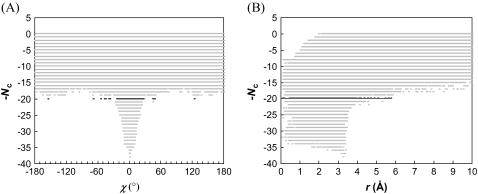
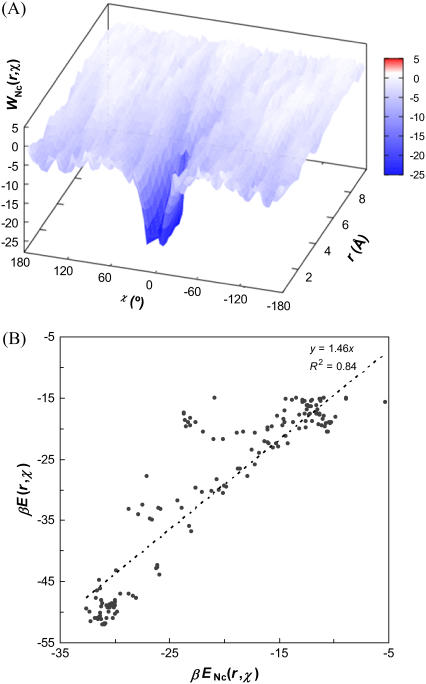
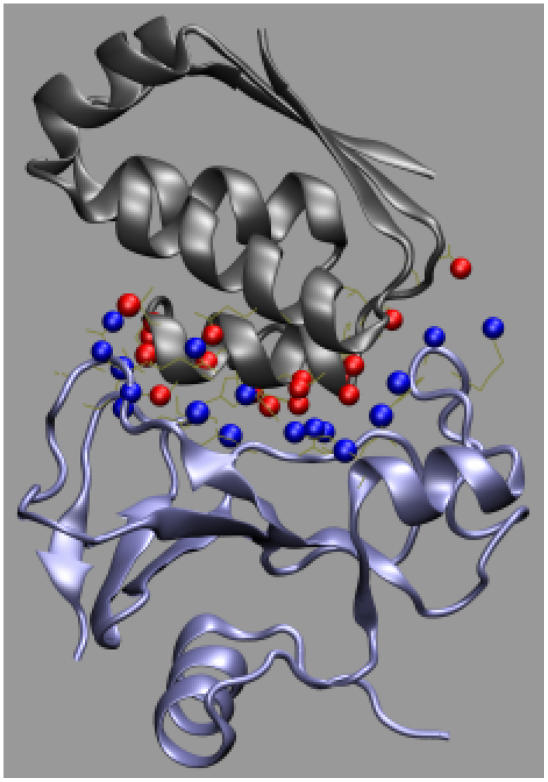
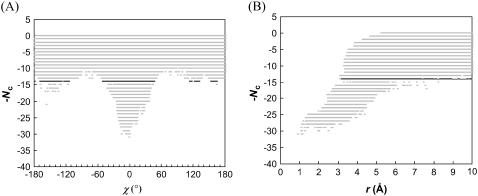
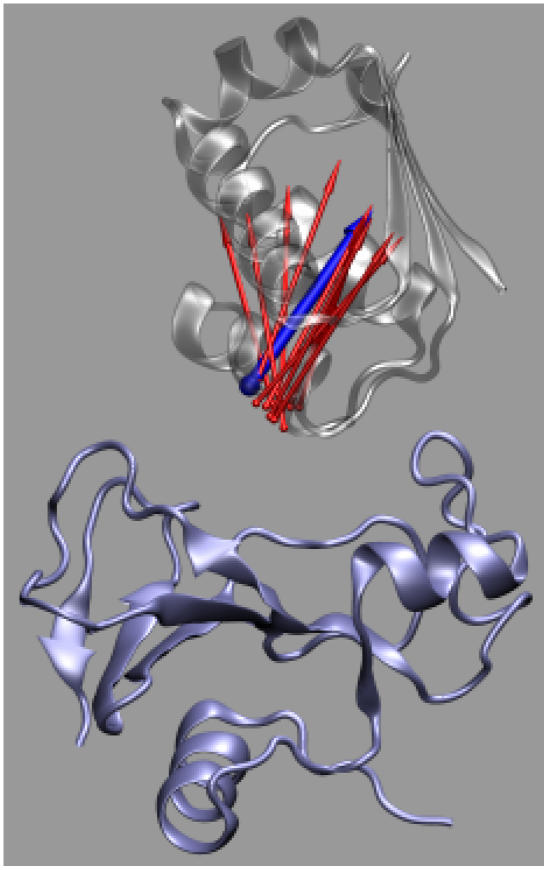
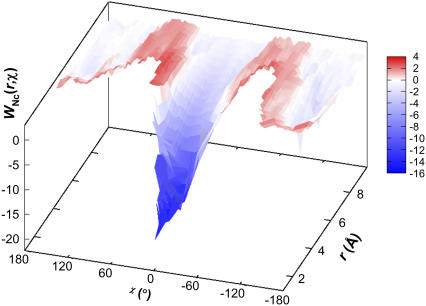
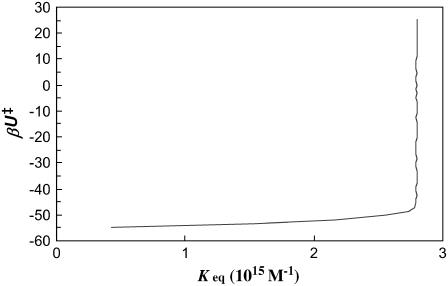
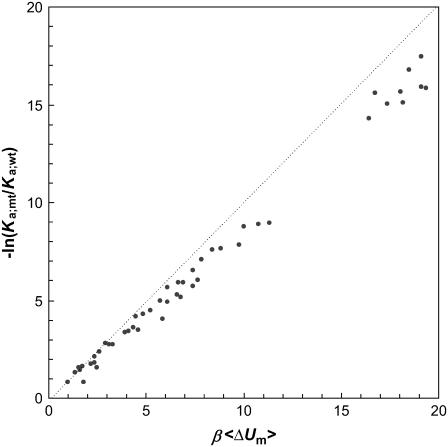
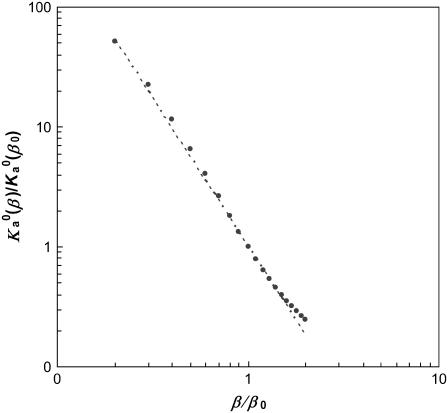
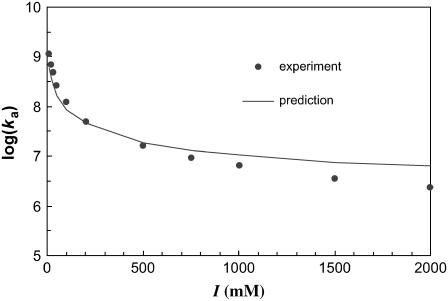
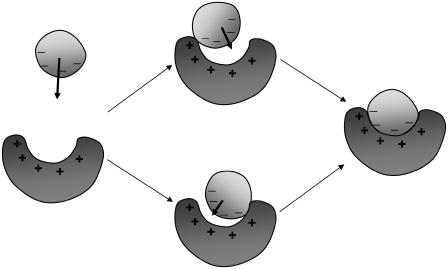
Formation of a stereospecific protein complex is favored by specific interactions between two proteins but disfavored by the loss of translational and rotational freedom. Echoing the protein folding process, we have previously proposed a transition state for protein-protein association. Here we clarify the specification of the transition state by working with two types of toy models for protein association. A "hemisphere" model consists of two matching hemispheres as associating proteins, and a "crater" model consists of a spherical protein with a crater to which another spherical protein fits snugly. Short-range pairwise interactions between sites across the interface hold together the bound complex. Small relative translation and rotation between the subunits quickly destroy the interactions, leading to a sharp transition between the bound state with numerous short-range interactions but restricted translation and rotational freedom and the unbound state with, at most, a small number of interactions but expanded configurational freedom. This transition sets the outer boundary of the bound state as well as the transition state for association. The energy landscape is funnel-like, with the deep well of the bound state surrounded by a broad shallow basin. Calculations with the toy models suggest that mutational change in the interaction energy in the x-ray structure of a protein-protein complex, commonly used to approximate the effect on the association constant, overestimates the effect of mutation by 10-20%. With an eye toward specifying the transition states of actual protein complexes, we find that the total number of contacts between the subunits serves as a good surrogate of the interaction energy. This formalism of protein-protein association is applied to the barnase-barstar complex, reproducing the experimental results for the association rate over a wide range of ionic strength.


Figures

FIGURE 1
FIGURE 1
(A) Definitions of the three translational (r) and three rotational (e and χ) degrees of freedom. (B) The hemisphere and (C) crater models in their minimum-energy configurations. (D) Side view of the interface between two subunits with two types of interaction sites: filled for h and open for p.
FIGURE 2
FIGURE 2
(A) Scatter plot of the interaction energy versus the rotation angle χ for the HL model. For clarity, the full range of χ is evenly divided into 500 bins and each bin contains at most one sampled χ-value at each energy level. The total number of sampled configurations is 107 (r0 = 10 Å). The transition-state energy level is indicated by dark points. (B) The standard deviation of χ and the parameter Ξ (Eq. 18) at different energy levels. An arrow indicates the transition-state energy level, where Ξ is maximal.
FIGURE 3
FIGURE 3
(A) Scatter plot of the interaction energy versus the relative separation r for the HL model. The full range of r (0–10 Å) is evenly divided into 500 bins and each bin contains at most one sampled r-value at each energy level (out of a total of 107 sampled configurations). (B) The free-energy functional W(r) and its energetic and entropic components.
FIGURE 4
FIGURE 4
The free-energy functional W(r, χ) for the (A) HL, (B) CL, (C) HS, and (D) CS models.
FIGURE 5
FIGURE 5
Scatter plots of the total contact number versus (A) the rotation angle χ and (B) relative separation r for the HL model. Dark points indicate formula image.
FIGURE 6
FIGURE 6
(A) The free-energy functional WNc(r, χ) for the HL model. (B) Correlation of the energetic component ENc(r, χ) with its counterpart E(r, χ). The values of the latter is restricted to <−15 kBT. This range of values covers the bound state and much of the transition region to the unbound state (correlation outside this range deteriorates). The line of linear regression (with zero intercept) is shown.
FIGURE 7
FIGURE 7
The interaction-locus atoms of the barnase-barstar complex. Barnase and barstar are shown in blue and gray, respectively; the interaction-locus atoms are shown as blue or red spheres.
FIGURE 8
FIGURE 8
Scatter plots of the total contact number versus (A) the rotation angle χ and (B) relative separation r for the barnase-barstar complex. Dark points indicate formula image. To ensure adequate sampling of the whole range of r from 0 to 10 Å, three independent runs are carried out with the upper bound of r set to 4, 6, and 10 Å, respectively. The sampled configurations are then combined.
FIGURE 9
FIGURE 9
Representative transition-state configurations. Barnase, shown in blue, is fixed in the laboratory frame whereas barstar is allowed to translate and rotate. The body-fixed unit vector e on barstar in different configurations is shown as arrows. For one particular configuration, the arrow is in blue and the corresponding structure of barstar is shown in gray.
FIGURE 10
FIGURE 10
The free-energy functional WNc(r, χ) for the barnase-barstar complex. Regions not covered by the free-energy surface are not sampled.
FIGURE 11
FIGURE 11
Calculated value of Ka versus the energy level used to define the outer boundary of the bound state.
FIGURE 12
FIGURE 12
Comparison of the effect of mutation on the association constant and the average change in interaction energy in the minimum-energy configurations of the wild-type CL model. The diagonal line indicated perfect agreement.
FIGURE 13
FIGURE 13
Temperature dependence of the prefactor formula image of the association constant. The line shows the power-law dependence, formula image.
FIGURE 14
FIGURE 14
Predicted and experimental results for the ionic-strength dependence of the barnase-barstar association rate.
FIGURE 15
FIGURE 15
Illustration of the mechanism of protein-protein association. The plus (+) and minus (–) signs indicate long-range electrostatic interactions or short-range native interactions. Arrows indicate translation toward the basin around the bound state or into the bound state (rotation is not shown). In the basin subsets of short ranges, native interactions are present.

References

    1. Zhou, H.-X. 2005. How do biomolecular systems speed up and regulate rates of processes? Phys. Biol. 2:R1–R25. - PubMed
    1. Chan, H. S., and K. A. Dill. 1998. Protein folding in the landscape perspective: chevron plots and non-Arrhenius kinetics. Proteins. 30:2–33. - PubMed
    1. Go, N., and H. Taketomi. 1978. Respective roles of short- and long-range interactions in protein folding. Proc. Natl. Acad. Sci. USA. 75:559–563. - PMC - PubMed
    1. Vijayakumar, M., K.-Y. Wong, G. Schreiber, A. R. Fersht, A. Szabo, and H.-X. Zhou. 1998. Electrostatic enhancement of diffusion-controlled protein-protein association: comparison of theory and experiment on barnase and barstar. J. Mol. Biol. 278:1015–1024. - PubMed
    1. Zhou, H.-X. 2001. Disparate ionic-strength dependencies of on and off rates in protein–protein association. Biopolymers. 59:427–433. - PubMed

Publication types

LinkOut - more resources