. 2007 Feb 15;92(4):1178-91.
doi: 10.1529/biophysj.106.092619. Epub 2006 Dec 1.

A biological interpretation of transient anomalous subdiffusion. I. Qualitative model

Affiliations

A biological interpretation of transient anomalous subdiffusion. I. Qualitative model

Michael J Saxton. Biophys J. .

Abstract

Anomalous subdiffusion has been reported for two-dimensional diffusion in the plasma membrane and three-dimensional diffusion in the nucleus and cytoplasm. If a particle diffuses in a suitable infinite hierarchy of binding sites, diffusion is well known to be anomalous at all times. But if the hierarchy is finite, diffusion is anomalous at short times and normal at long times. For a prescribed set of binding sites, Monte Carlo calculations yield the anomalous diffusion exponent and the average time over which diffusion is anomalous. If even a single binding site is present, there is a very short, almost artifactual, period of anomalous subdiffusion, but a hierarchy of binding sites extends the anomalous regime considerably. As is well known, an essential requirement for anomalous subdiffusion due to binding is that the diffusing particle cannot be in thermal equilibrium with the binding sites; an equilibrated particle diffuses normally at all times. Anomalous subdiffusion due to barriers, however, still occurs at thermal equilibrium, and anomalous subdiffusion due to a combination of binding sites and barriers is reduced but not eliminated on equilibration. This physical model is translated directly into a plausible biological model testable by single-particle tracking.


Figures
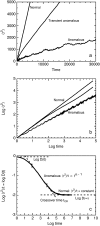
FIGURE 1
FIGURE 1
Types of diffusion considered. Mean-square displacement 〈r2〉 as a function of time t for normal diffusion, transient anomalous subdiffusion, and pure anomalous subdiffusion. (a) Linear plot. (b) Log-log plot. Normal diffusion is a random walk on an unobstructed triangular lattice. In notation to be explained later, the transiently anomalous curve is for a hierarchy of traps 8/4/2/− with total trap concentration 14/1024 = 0.01367 and PESC = 0.1. Pure anomalous subdiffusion is from the Weierstrass-Mandelbrot equation (18) with exponent α = 0.720 to match the slope of the power-law part of the transiently anomalous curve. The log-periodicity is an artifact of this function. (c) Method of analysis of transient anomalous subdiffusion. The Monte Carlo data is plotted as log 〈r2〉/t = log D(t) versus log t. The mean-square displacement is normalized so that D = 1 for a system without traps. The initial value is log D(0). The slope of the power-law region yields the anomalous diffusion exponent α; the value in the normal region yields the limiting normal diffusion coefficient log D(∞); and the intersection of the lines yields the crossover time tCR. The vertical lines mark the power-law region, defined as the region in which the curve is linear to within a few percent. In this plot pure normal diffusion gives a horizontal line and pure anomalous subdiffusion gives a straight line of slope α – 1.
FIGURE 2
FIGURE 2
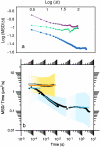
Experimental data for the mean-square displacement (MSD) from SPT. Log-log plots of 〈r2〉/t as a function of time t (or equivalently the lag time Δt). (a) Anomalous subdiffusion of Cajal bodies in the nucleus of HeLa cells (4). (Blue) Untreated cells. (Green) Cells treated with the transcriptional inhibitor actinomycin D. (Purple) ATP-depleted cells. (Adapted by permission from Macmillan Publishers Ltd., Nature Cell Biology, 4:502–508, copyright 2002.) (b) Anomalous subdiffusion of gold-labeled dioleoylPE in fetal rat skin keratinocyte cells (13). (Upper curve) Control showing normal diffusion in blebs. (Lower curve) Data points obtained at time resolutions of 25 μs, 110 μs, and 33 ms. (Straight lines) Least-squares fits to the data; (blue and yellow vertical bars) standard deviations. (Adapted by permission from Biophysical Journal, copyright 2004.)
FIGURE 3
FIGURE 3
Schematic form of a finite hierarchy from truncation of the infinite hierarchy of Table 1. (Open circles) Nonbinding sites. (Solid circles) Binding sites. As the traps grow deeper, the escape time increases by a factor of 1/P at each step, where P is the escape probability per time step from the shallowest traps. This hierarchy will be written as 16/8/4/2/T, where T is the target site, or 16/8/4/2/− when the target site is omitted.
FIGURE 4
FIGURE 4
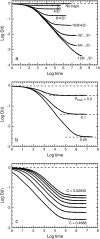
A finite hierarchy leads to an initial period of anomalous subdiffusion, followed by a crossover to normal diffusion. Results here are for two-dimensional random walks on a triangular lattice. The corresponding results for square and cubic lattices are very similar. (a) Effect of increasing the number of levels in the hierarchy: No traps, 2/−, 4/2/−, 8/4/2/−, 16/8/4/2/−, 32/16/8/4/2/−, 64/…/2/−, and 128/…/2/−, with PESC = 0.1. One set of traps was used and the system size was varied between 8 × 8 and 94 × 94 to keep the total trap concentration as constant as possible. The concentration was 0.02958 ± 0.00096, that is, an SD of 3.26% of the mean. No targets were present. (b) Effect of PESC for a constant hierarchy 16/8/4/2/−. Here PESC = 0.2, 0.1, and 0.05, the trap concentration is 30/1024 = 0.02930, and the lattice size is 32 × 32. (c) Effect of concentration C for a constant hierarchy 16/8/4/2/−. Here a single set of 30 traps was used, and the lattice edge was set to 32, 28, 24, 20, 16, 12, and 8, giving C = 0.02930, 0.03827, 0.05208, 0.07500, 0.1172, 0.2083, and 0.4688, with PESC = 0.1.
FIGURE 5
FIGURE 5
Comparison of the effects of a single deep trap, −/−/−/1/−, a four-level set of traps with a fixed number of traps per level, 7/7/7/7/−, and the standard hierarchy 16/8/4/2/−. Here PESC was set to 0.07958, 0.1364, and 0.1, respectively, so that the mean escape time 〈tESC〉 and therefore the limiting value D(∞) were constant. The lattice size was 32 × 32. As the traps are varied from the single deep trap to the uniform distribution to the standard hierarchy, the width of the anomalous region increases from 0.82 to 1.29 to 1.79 in units of log t but diffusion grows less anomalous, with α increasing from 0.23 to 0.44 to 0.54.
FIGURE 6
FIGURE 6
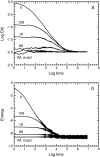
Effect of annealing time on a two-dimensional random walk on the triangular lattice. The standard trap hierarchy was used, 16/8/4/2/− with PESC = 0.1, with 1000 sets of traps on a 512 × 512 lattice, giving a trap concentration of 0.1144. The corresponding plots for random walks on the cubic lattice are very similar. (a) Log-log plots of 〈r2〉/t versus time for various initial conditions. (b) Plots of energy versus log time for the same initial conditions. The diffusing particle was placed in a random initial position and annealed for 0, 128, 1 K, 8 K, or 1 M time steps as indicated, or it was placed in a random initial position determined from a Boltzmann distribution (exact). Then the mean-square displacement and energy were recorded. The changes in noise levels are due to changes in the sampling time.
FIGURE 7
FIGURE 7
Potentials defining the different one-dimensional models. See text for details. Circles represent lattice sites.
FIGURE 8
FIGURE 8
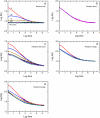
Effect of annealing time on a one-dimensional random walk for the different models. Annealing times are 0, 32, 1 K, 32 K, and 1 M; exact, from the equilibrium Boltzmann distribution. In panels ad, 1000 lattice points were used, and in panel e, 3000 points. All sites or bonds were assigned random energies. The y axis is 1.5 units in all panels but shifted as required. (a) Random site model with a truncated Gaussian distribution of binding energies, mean 2.5, SD 1.5. (b) Random bond model, with the barrier heights from the same distribution. (c) Random site-bond model, with truncated Gaussian distributions of site energies and barrier heights, with mean 1.25 and SD 1.50. (d) Random energy model, with the same distribution of energies as the random site model. (e) Barbi random energy model with a nontruncated Gaussian distribution of site energies, mean −1.0 and SD 1.5. Barbi et al. (9,10) used the same mean and an SD ∼2.5.
FIGURE 9
FIGURE 9
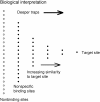
The biological interpretation of the hierarchy (see text). (Open circles) Nonbinding sites. (Solid circles) Binding sites with the binding growing stronger to the right.
FIGURE 10
FIGURE 10
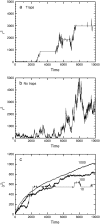
Observability of trapping. (a) Square displacement r2 versus time t for a single random walk with trapping, assuming the standard hierarchy 16/8/4/2/− with PESC = 0.1 and total trap concentration 0.02930. (b) The corresponding plot for a single pure random walk with no trapping or confinement. The curves in panels a and b were selected to make the point about the problem of apparent trapping, but they were selected from only five curves of each kind, and the problem is real. (c) Mean-square displacement 〈r2〉 averaged over 10, 100, and 1000 tracers for the same traps as in panel a.

Comment in

References

    1. Stauffer, D., and A. Aharony. 1992. Introduction to Percolation Theory, 2nd Ed. Taylor & Francis, London.
    1. Saxton, M. J. 1994. Anomalous diffusion due to obstacles: a Monte Carlo study. Biophys. J. 66:394–401. - PMC - PubMed
    1. Bouchaud, J. P., and A. Georges. 1990. Anomalous diffusion in disordered media. Statistical mechanisms, models and physical applications. Phys. Rep. 195:127–293.
    1. Platani, M., I. Goldberg, A. I. Lamond, and J. R. Swedlow. 2002. Cajal body dynamics and association with chromatin are ATP-dependent. Nat. Cell Biol. 4:502–508. - PubMed
    1. Saxton, M. J. 1996. Anomalous diffusion due to binding: a Monte Carlo study. Biophys. J. 70:1250–1262. - PMC - PubMed

Publication types