. 2006 Dec 12;103(50):18969-74.
doi: 10.1073/pnas.0608636103. Epub 2006 Dec 1.

The Spemann organizer gene, Goosecoid, promotes tumor metastasis

Affiliations

The Spemann organizer gene, Goosecoid, promotes tumor metastasis

Kimberly A Hartwell et al. Proc Natl Acad Sci U S A. .

Abstract

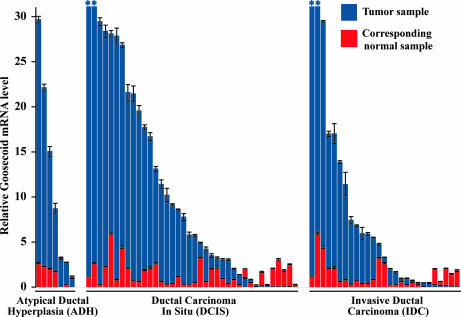
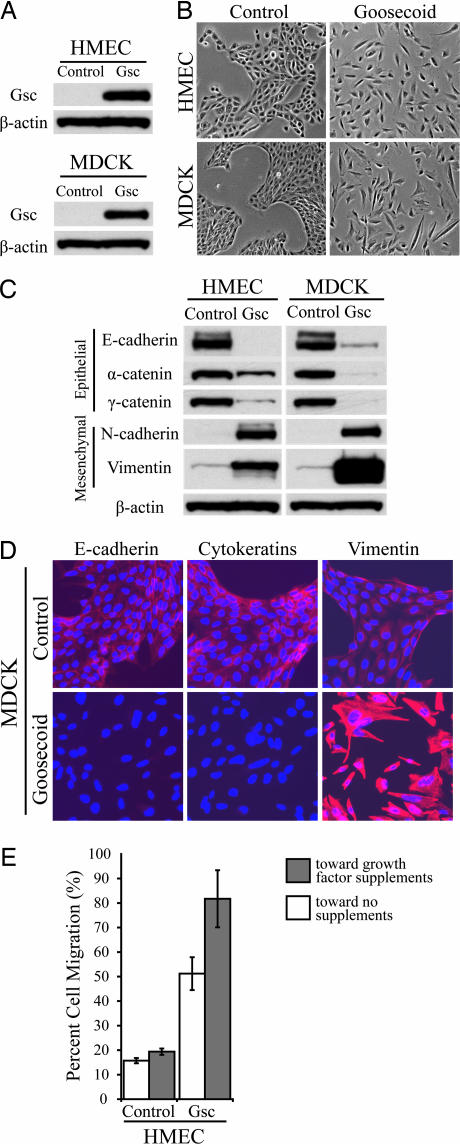
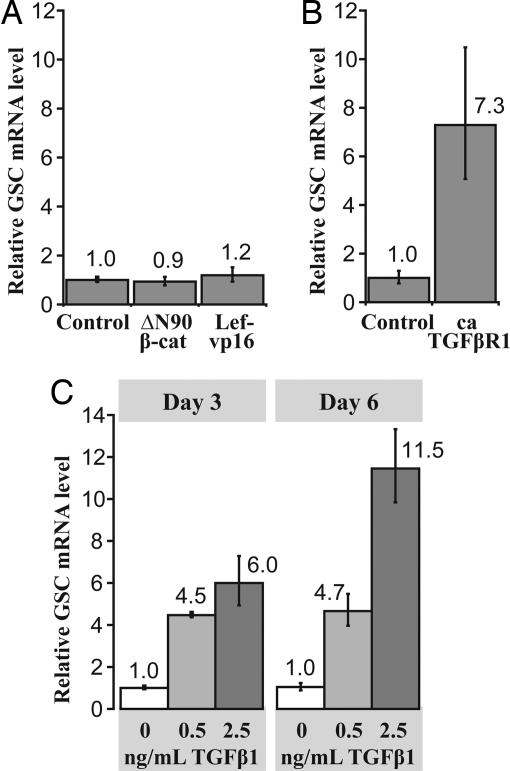
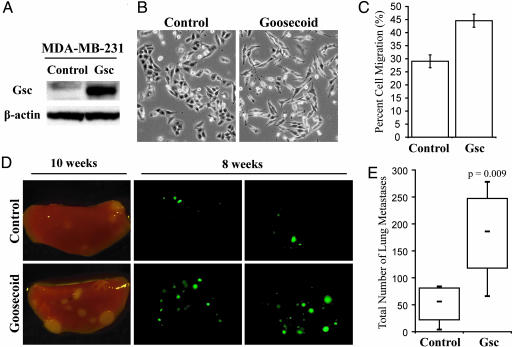
The process of invasion and metastasis during tumor progression is often reminiscent of cell migration events occurring during embryonic development. We hypothesized that genes controlling cellular changes in the Spemann organizer at gastrulation might be reactivated in tumors. The Goosecoid homeobox transcription factor is a known executer of cell migration from the Spemann organizer. We found that indeed Goosecoid is overexpressed in a majority of human breast tumors. Ectopic expression of Goosecoid in human breast cells generated invasion-associated cellular changes, including an epithelial-mesenchymal transition. TGF-beta signaling, known to promote metastasis, induced Goosecoid expression in human breast cells. Moreover, Goosecoid significantly enhanced the ability of breast cancer cells to form pulmonary metastases in mice. These results demonstrate that Goosecoid promotes tumor cell malignancy and suggest that other conserved organizer genes may function similarly in human cancer.


Conflict of interest statement

The authors declare no conflict of interest.

Figures

Fig. 1.
Fig. 1.
Quantification of Goosecoid expression in human tumors. The relative level of GSC mRNA in each tumor (blue) and corresponding normal (red) tissue sample is shown with the lowest value of each pair in foreground. Pairs are grouped by tumor pathological subtype and sorted within groups according to the level of GSC mRNA in the tumor samples. All values displayed were normalized to the average of the GSC mRNA levels in the normal samples, which is set as the y value 1 in the graph. Values outside the scale of the y axis are marked by an asterisk.
Fig. 2.
Fig. 2.
Effects of Goosecoid expression in immortalized human breast and canine kidney epithelial cells. (A) Ectopic expression of Gsc in HMECs and in MDCK epithelial cells by Western blotting. (B) Phase-contrast micrographs of HMECs and MDCK cells expressing either Gsc or GFP control. (C) Expression levels of epithelial proteins E-cadherin, α-catenin, and γ-catenin and mesenchymal proteins N-cadherin and vimentin in HMECs and MDCK cells expressing either Gsc or GFP control by Western blotting. β-Actin protein is shown as a loading control. (D) Immunofluorescence staining for epithelial proteins E-cadherin and cytokeratins and mesenchymal protein vimentin in MDCK cells expressing either Gsc or GFP control. Antibody staining is shown in red, and Hoechst nuclear staining is shown in blue. (E) Quantification of the migratory abilities of HMECs expressing Gsc or GFP control by transwell migration assay. Movement toward medium with or without growth factor supplements (EGF, insulin, and hydrocortisone) is graphed as the percentage of total cells assayed that migrated after 48 h. Assays were done in triplicate, and the averages with SEM are shown.
Fig. 3.
Fig. 3.
Induction of Goosecoid in HMECs. (A) Relative GSC mRNA expression levels in HMECs containing empty vector, nondegradable β-catenin (ΔN90 β-cat), or constitutively active Lef-1 (Lef-vp16). Each bar represents the average with SEM of triplicate assays. (B) Relative GSC mRNA expression levels in HMECs expressing either empty vector or constitutively active TGF-β type 1 receptor. Each bar represents the average with SEM of triplicate assays. (C) Relative GSC mRNA expression levels in HMECs treated with activated TGF-β1 ligand at various concentrations for 3 or 6 days. Each bar represents the average with SEM of triplicate assays.
Fig. 4.
Fig. 4.
Goosecoid expression changes the behavior of MDA-MB-231 human breast cancer cells in vitro and in mice. (A) Gsc expression in MDA-MB-231 cells expressing either Gsc or GFP control by Western blotting. (B) Phase-contrast micrographs of MDA-MB-231 cells expressing either Gsc or GFP control. (C) Quantification of the migratory abilities of MDA-MB-231 cells expressing Gsc or GFP control by transwell assay, graphed as the percentage of total cells assayed that migrated after 16 h. Assays were done in triplicate, and the averages with SEM are shown. (D) Representative brightfield and fluorescence images of mouse lung lobes 10 or 8 weeks after tail vein injection of MDA-MB-231 cells expressing either Gsc or GFP control. (E) Quantification of the number of metastatic foci in the lungs of mice 8 weeks after tail vein injection of MDA-MB-231 cells expressing either Gsc or GFP control (n ≥ 6; trend was confirmed by four independent experiments). Quartiles, medians, and the P value of the mean are shown.

References

    1. Fidler IJ. Nat Rev Cancer. 2003;3:453–458. - PubMed
    1. Thiery JP. Nat Rev Cancer. 2002;2:442–454. - PubMed
    1. Niehrs C. Nat Rev Genet. 2004;5:425–434. - PubMed
    1. Gilbert SF. Developmental Biology. Sunderland, MA: Sinauer; 1997. pp. 209–252.
    1. Thiery JP, Sleeman JP. Nat Rev Mol Cell Biol. 2006;7:131–142. - PubMed

Publication types

MeSH terms