

Classical transient receptor potential channel 6 (TRPC6) is essential for hypoxic pulmonary vasoconstriction and alveolar gas exchange
- PMID: 17142322
- PMCID: PMC1748182
- DOI: 10.1073/pnas.0606728103
Classical transient receptor potential channel 6 (TRPC6) is essential for hypoxic pulmonary vasoconstriction and alveolar gas exchange
Abstract
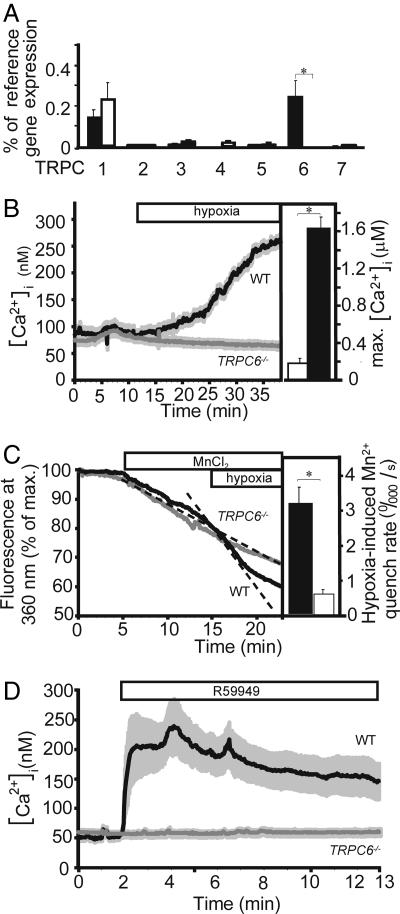
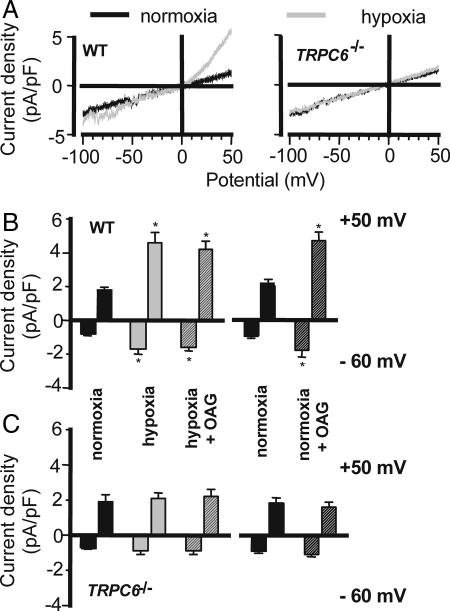
Regional alveolar hypoxia causes local vasoconstriction in the lung, shifting blood flow from hypoxic to normoxic areas, thereby maintaining gas exchange. This mechanism is known as hypoxic pulmonary vasoconstriction (HPV). Disturbances in HPV can cause life-threatening hypoxemia whereas chronic hypoxia triggers lung vascular remodeling and pulmonary hypertension. The signaling cascade of this vitally important mechanism is still unresolved. Using transient receptor potential channel 6 (TRPC6)-deficient mice, we show that this channel is a key regulator of acute HPV as this regulatory mechanism was absent in TRPC6(-/-) mice whereas the pulmonary vasoconstrictor response to the thromboxane mimetic U46619 was unchanged. Accordingly, induction of regional hypoventilation resulted in severe arterial hypoxemia in TRPC6(-/-) but not in WT mice. This effect was mirrored by a lack of hypoxia-induced cation influx and currents in smooth-muscle cells from precapillary pulmonary arteries (PASMC) of TRPC6(-/-) mice. In both WT and TRPC6(-/-) PASMC hypoxia caused diacylglycerol (DAG) accumulation. DAG seems to exert its action via TRPC6, as DAG kinase inhibition provoked a cation influx only in WT but not in TRPC6(-/-) PASMC. Notably, chronic hypoxia-induced pulmonary hypertension was independent of TRPC6 activity. We conclude that TRPC6 plays a unique and indispensable role in acute hypoxic pulmonary vasoconstriction. Manipulation of TRPC6 function may thus offer a therapeutic strategy for the control of pulmonary hemodynamics and gas exchange.
Conflict of interest statement
The authors declare no conflict of interest.
Figures


Similar articles
-
Diacylglycerol regulates acute hypoxic pulmonary vasoconstriction via TRPC6.Respir Res. 2011 Feb 4;12(1):20. doi: 10.1186/1465-9921-12-20. Respir Res. 2011. PMID: 21294865 Free PMC article.
-
Notch Activation of Ca(2+) Signaling in the Development of Hypoxic Pulmonary Vasoconstriction and Pulmonary Hypertension.Am J Respir Cell Mol Biol. 2015 Sep;53(3):355-67. doi: 10.1165/rcmb.2014-0235OC. Am J Respir Cell Mol Biol. 2015. PMID: 25569851 Free PMC article.
-
CFTR and sphingolipids mediate hypoxic pulmonary vasoconstriction.Proc Natl Acad Sci U S A. 2015 Mar 31;112(13):E1614-23. doi: 10.1073/pnas.1421190112. Epub 2015 Mar 17. Proc Natl Acad Sci U S A. 2015. PMID: 25829545 Free PMC article.
-
The role of classical transient receptor potential channels in the regulation of hypoxic pulmonary vasoconstriction.Adv Exp Med Biol. 2010;661:187-200. doi: 10.1007/978-1-60761-500-2_12. Adv Exp Med Biol. 2010. PMID: 20204731 Review.
-
The role of k+ channels in determining pulmonary vascular tone, oxygen sensing, cell proliferation, and apoptosis: implications in hypoxic pulmonary vasoconstriction and pulmonary arterial hypertension.Microcirculation. 2006 Dec;13(8):615-32. doi: 10.1080/10739680600930222. Microcirculation. 2006. PMID: 17085423 Review.
Cited by
-
11,12-EET stimulates the association of BK channel α and β(1) subunits in mitochondria to induce pulmonary vasoconstriction.PLoS One. 2012;7(9):e46065. doi: 10.1371/journal.pone.0046065. Epub 2012 Sep 24. PLoS One. 2012. PMID: 23029390 Free PMC article.
-
SNF8, a member of the ESCRT-II complex, interacts with TRPC6 and enhances its channel activity.BMC Cell Biol. 2012 Nov 21;13:33. doi: 10.1186/1471-2121-13-33. BMC Cell Biol. 2012. PMID: 23171048 Free PMC article.
-
Ceramide and Regulation of Vascular Tone.Int J Mol Sci. 2019 Jan 18;20(2):411. doi: 10.3390/ijms20020411. Int J Mol Sci. 2019. PMID: 30669371 Free PMC article. Review.
-
Role of Store-Operated Ca2+ Entry in the Pulmonary Vascular Remodeling Occurring in Pulmonary Arterial Hypertension.Biomolecules. 2021 Nov 27;11(12):1781. doi: 10.3390/biom11121781. Biomolecules. 2021. PMID: 34944425 Free PMC article. Review.
-
Differences in STIM1 and TRPC expression in proximal and distal pulmonary arterial smooth muscle are associated with differences in Ca2+ responses to hypoxia.Am J Physiol Lung Cell Mol Physiol. 2008 Jul;295(1):L104-13. doi: 10.1152/ajplung.00058.2008. Epub 2008 Apr 18. Am J Physiol Lung Cell Mol Physiol. 2008. PMID: 18424621 Free PMC article.
References
-
- Jeffery TK, Wanstall JC. Pharmacol Ther. 2001;92:1–20. - PubMed
-
- Weissmann N, Winterhalder S, Nollen M, Voswinckel R, Quanz K, Ghofrani HA, Schermuly RT, Seeger W, Grimminger F. Am J Physiol. 2001;280:L638–L645. - PubMed
-
- Sartori C, Allemann Y, Trueb L, Delabays A, Nicod P, Scherrer U. Lancet. 1999;353:2205–2207. - PubMed
-
- Weigand L, Foxson J, Wang J, Shimoda LA, Sylvester JT. Am J Physiol. 2005;289:L5–L13. - PubMed
Publication types
MeSH terms
Substances
LinkOut - more resources
Full Text Sources
Other Literature Sources
Medical
Molecular Biology Databases
