. 2006 Dec 4:6:44.
doi: 10.1186/1472-6750-6-44.

Two-temperature LATE-PCR endpoint genotyping

Affiliations

Two-temperature LATE-PCR endpoint genotyping

J Aquiles Sanchez et al. BMC Biotechnol. .

Abstract

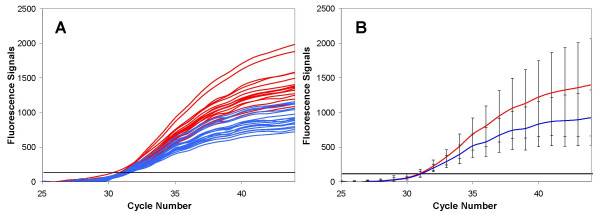
Background: In conventional PCR, total amplicon yield becomes independent of starting template number as amplification reaches plateau and varies significantly among replicate reactions. This paper describes a strategy for reconfiguring PCR so that the signal intensity of a single fluorescent detection probe after PCR thermal cycling reflects genomic composition. The resulting method corrects for product yield variations among replicate amplification reactions, permits resolution of homozygous and heterozygous genotypes based on endpoint fluorescence signal intensities, and readily identifies imbalanced allele ratios equivalent to those arising from gene/chromosomal duplications. Furthermore, the use of only a single colored probe for genotyping enhances the multiplex detection capacity of the assay.

Results: Two-Temperature LATE-PCR endpoint genotyping combines Linear-After-The-Exponential (LATE)-PCR (an advanced form of asymmetric PCR that efficiently generates single-stranded DNA) and mismatch-tolerant probes capable of detecting allele-specific targets at high temperature and total single-stranded amplicons at a lower temperature in the same reaction. The method is demonstrated here for genotyping single-nucleotide alleles of the human HEXA gene responsible for Tay-Sachs disease and for genotyping SNP alleles near the human p53 tumor suppressor gene. In each case, the final probe signals were normalized against total single-stranded DNA generated in the same reaction. Normalization reduces the coefficient of variation among replicates from 17.22% to as little as 2.78% and permits endpoint genotyping with >99.7% accuracy. These assays are robust because they are consistent over a wide range of input DNA concentrations and give the same results regardless of how many cycles of linear amplification have elapsed. The method is also sufficiently powerful to distinguish between samples with a 1:1 ratio of two alleles from samples comprised of 2:1 and 1:2 ratios of the same alleles.

Conclusion: SNP genotyping via Two-Temperature LATE-PCR takes place in a homogeneous closed-tube format and uses a single hybridization probe per SNP site. These assays are convenient, rely on endpoint analysis, improve the options for construction of multiplex assays, and are suitable for SNP genotyping, mutation scanning, and detection of DNA duplication or deletions.


Figures

Figure 1
Figure 1
Fluorescent signal scatter in symmetric PCR assays. Replicate sets of homozygous normal (red lines) and heterozygous (blue lines) DNA for the TSD Δ1278 allele of the human HEXA gene were amplified using symmetric PCR. Reactions were monitored using a molecular beacon probe against the normal HEXA allele. The molecular beacon probe is allele-discriminating and recognizes 100% of the alleles in the homozygous normal samples but only 50% of the alleles in heterozygous samples. As a result, the probe fluorescence signals should theoretically be twice as intense in homozygous normal samples compared to heterozygous samples. Each reaction contained 1000 genome-equivalents of genomic DNA. Panel A: Kinetic plots of accumulated amplification products detected by the molecular beacon probe in replicate samples. Signal scattering among replicate samples due to stochastic factors influencing PCR in individual tubes prevents unambiguous identification of homozygous and heterozygous samples based on final fluorescence signal intensity. Panel B: Statistical analysis of data in Panel A. Solid lines represent the average fluorescence intensity values (red: homozygous normal samples; blue: heterozygous samples), error bars corresponds to three-standard deviations of the mean of the fluorescence signals at each amplification cycle which defines the range of fluorescence signals encompassing 99.7% of samples for each genotype. The extensive overlap between the error bars of homozygous normal and heterozygous samples demonstrates that these samples cannot be identified based solely on final fluorescence signal intensity at any amplification cycle.
Figure 2
Figure 2
Fluorescent signal scatter in LATE-PCR assays. Panel A: Kinetic plots of accumulated amplification products detected by the molecular beacon probe in replicate samples. Replicate sets of homozygous normal (red lines) and heterozygous (blue lines) samples for the TSD Δ1278 allele (n = 18 each) were amplified using LATE-PCR and monitored in the course of the reaction using a molecular beacon probe against the normal allele. Each reaction contained 1000 genomes equivalent of genomic DNA. Panel B: Statistical analysis of data in Panel A. Solid lines correspond to the average fluorescence values of each replicate set (red: homozygous normal samples; blue: heterozygous samples), error bars correspond to three-standard deviations of the mean which encompasses 99.7.% of all possible samples in each replicate set distribution. LATE-PCR does reduce the overlap between the error bars of each replicate set compared to Figure 1 but still does not permit unambiguous identification of each genotype.
Figure 3
Figure 3
Two-Temperature LATE-PCR Genotyping. Panel A: Kinetic plots of ResonSense® Cy5 signals collected at 55°C, a temperature at which the probe is allele-discriminating and binds exclusively to the normal allele. Under allele discriminating conditions, replicate homozygous normal samples (red lines) have, on the average, higher fluorescence signals than heterozygous replicates (blue lines) but signal scatter prevents identification of individual genotypes based on this type of kinetic analysis. Panel B: Kinetic plots of ResonSense® Cy5 signals collected at 40°C, a temperature at which the probe becomes mismatch-tolerant and binds both the TSD normal and G269 alleles. Under mismatch-tolerant conditions, homozygous replicates (red lines) and heterozygous replicates (blue lines) exhibit, on the average, very similar fluorescence signals which reflect the total amount of amplification product in each tube. Panel C: Plot of ratio of Cy5 fluorescence signals collected under allele-discriminating (Panel A) and mismatch-tolerant (panel B) conditions. Normalization using the ratio of fluorescent signals collected at temperatures permissive for either allele-specific or mismatch-tolerant probe binding generates characteristic fluorescent signatures that are unique to each genotype. Once established, these signatures do not vary significantly as a function of the extent of the amplification reaction making them suitable for endpoint analysis (red lines, homozygous samples; blue lines, heterozygous samples). Panel D: Statistical analysis of data in Panel C. Red and blue lines correspond to the average fluorescence values of each replicate set of homozygous normal and heterozygous samples, respectively. Error bars correspond to three-standard deviations of the mean which encompasses 99.7% of all possible samples in each replicate set distribution. The absence of overlap between the error bars two cycles after the fluorescent signals ratio is first above background demonstrates that homozygous normal and heterozygous samples can be unambiguously identified by this method with 99.7% certainty.
Figure 4
Figure 4
Fluorescence ratios generated by Two-Temperature LATE-PCR genotyping are independent of starting genome copy number. This figure shows a plot of the ratio of Cy5 readings at 50°C and 25°C derived from a LATE-PCR amplification of the genomic DNA segment containing the rs858521 [C/G] SNP monitored with a ResonSense® probe against the rs858521 C allele. Red lines, homozygous CC replicates containing 2000 starting genomes; red dotted lines, homozygous CC replicates containing 100 starting genomes. Both sets of replicate homozygous samples generate the same two-temperature fluorescence ratio even though these samples differ in their amount of starting material.
Figure 5
Figure 5
Identification of imbalance allele ratios using the Two-Temperature LATE-PCR endpoint assay. Replicate samples (n = 16) containing 1000 genome-equivalents of heterozygous TSD G269 DNA (1:1 C to G allele ratio) or a DNA mixture containing a 2:1 ratio of the same two alleles (see Materials and Methods) were analyzed by Two-Temperature LATE-PCR using primer/probe pairs for the TSD G269 polymorphism. Fluorescence signals were collected prior to LATE-PCR amplification at 70°C and after LATE-PCR amplification at 52°C and 40°C to calculate the normalized endpoint fluorescence ratios (see Materials and Methods). Blue dots, heterozygous (1:1 C-toG allele ratio) fluorescence ratios; green dots, DNA mixture (2:1 C-to-G allele ratio). The black boxes represent the boundary of three-standard deviations on either side of the mean of replicate control samples signals for each genotype and statistically define the 99.7% confidence interval for identification of each genotype.
Figure 6
Figure 6
Two-Temperature LATE-PCR endpoint genotyping of the rs2270517 SNP in blinded DNA samples. Control replicate DNA samples corresponding to various known genotypes for the rs2270517 SNP were analyzed by Two-Temperature LATE-PCR using primer/probe pairs for the rs2270517 (C/T alleles) and a mismatch-tolerant probe specific for the C allele at high temperatures. Fluorescence signals were collected after LATE-PCR amplification at 57°C and 45°C and were used to calculate fluorescence ratios. In an initial experiment, replicate samples of each rs2270517 genotype (n = 26) were used to determine the distribution of fluorescence ratios corresponding to each genotype. Red dots indicate homozygous CC control samples, blue dots indicate the heterozygous CT control samples, and green dots indicate homozygous TT control samples. The boxes represent the boundary of three-tandard deviations on either side of the mean of replicate control samples signals for each genotype. Therefore, each box defines the range of fluorescence ratios statistically encompassing 99.7% of all possible samples of any given genotype in this assay. In two subsequent separate experiments, samples of known rs2270517 genotype that were blinded to the experimenter (coded samples A, B, C, D, E, and F in the figure) along with a set of control samples of known genotypes were processed to determine their fluorescence ratios in duplicate. These fluorescence ratios are shown in the figure as orange circles labelled with the sample designation; some of the circles from individual samples overlap in the figure. The data shows that the fluorescence ratios from each of the blinded samples fell within one of the defined ranges of normalized control fluorescence ratios. The same was observed for the set of control samples (shown as red, blue, or green dots according to genotype as specified above). There was 100% concordance in the genotype assignment when the blinded samples were decoded.

Similar articles

Cited by

References

    1. Kainz P. The PCR plateau phase – towards an understanding of its limitations. Biochim Biophys Acta. 2000;1494:23–27. - PubMed
    1. Freeman WM, Walker SJ, Vrana KE. Quantitative RT-PCR: pitfalls and potential. Biotechniques. 1999;26:112–125. - PubMed
    1. Morrison C, Gannon F. The impact of the PCR plateau phase on quantitative PCR. Biochim Biophys Acta. 1994;1219:493–498. - PubMed
    1. Schmittgen TD, Zakrajsek BA, Mills AG, Gorn V, Singer MJ, Reed MW. Quantitative reverse transcription-polymerase chain reaction to study mRNA decay: comparison of endpoint and real-time methods. Anal Biochem. 2000;285:194–204. doi: 10.1006/abio.2000.4753. - DOI - PubMed
    1. Wong ML, Medrano JF. Real-time PCR for mRNA quantitation. Biotechniques. 2005;39:75–85. - PubMed

Publication types

Substances