. 2006 Dec 7;52(5):789-801.
doi: 10.1016/j.neuron.2006.10.024.

MEKK4 signaling regulates filamin expression and neuronal migration

Affiliations

MEKK4 signaling regulates filamin expression and neuronal migration

Matthew R Sarkisian et al. Neuron. .

Abstract

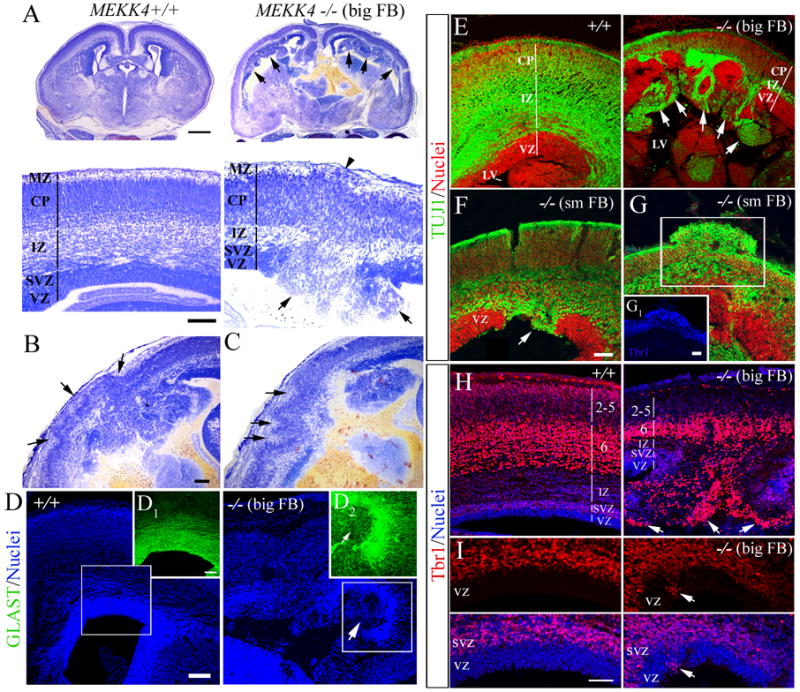
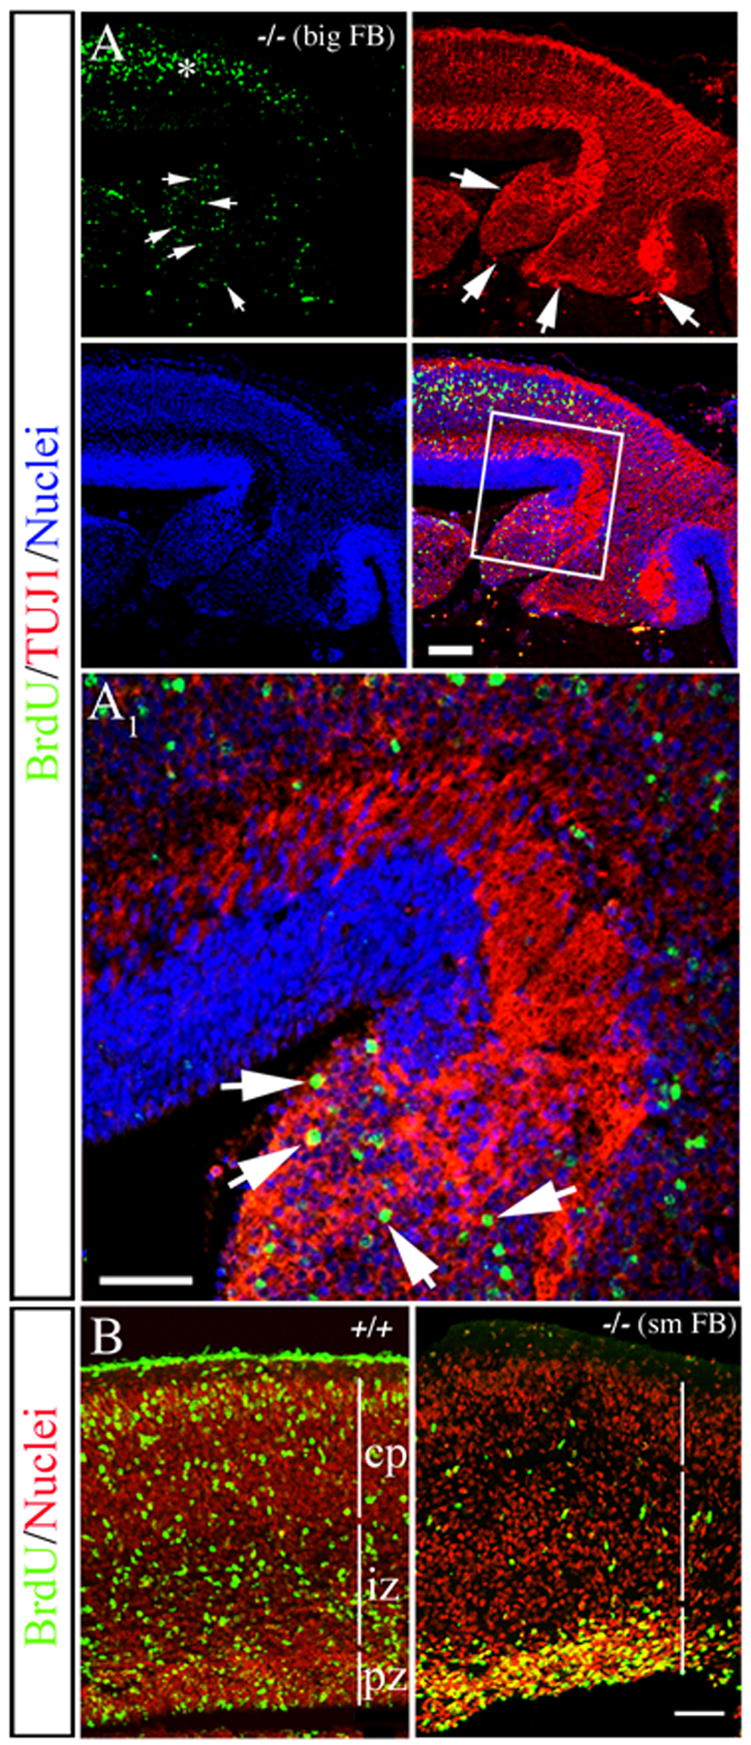
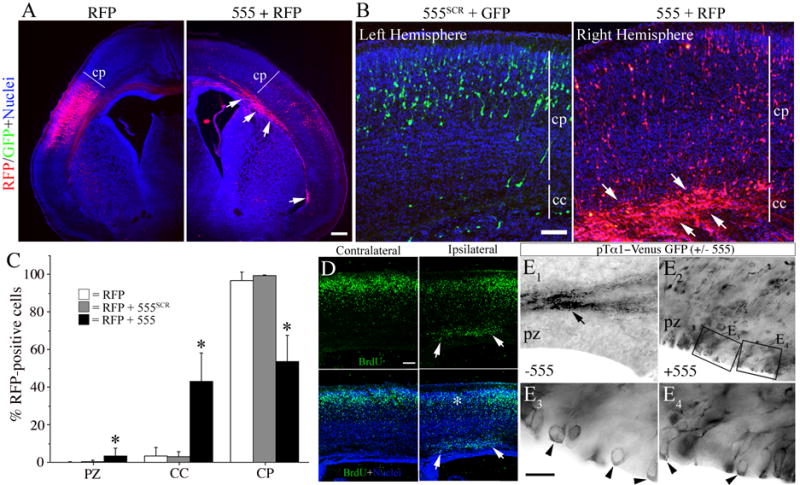
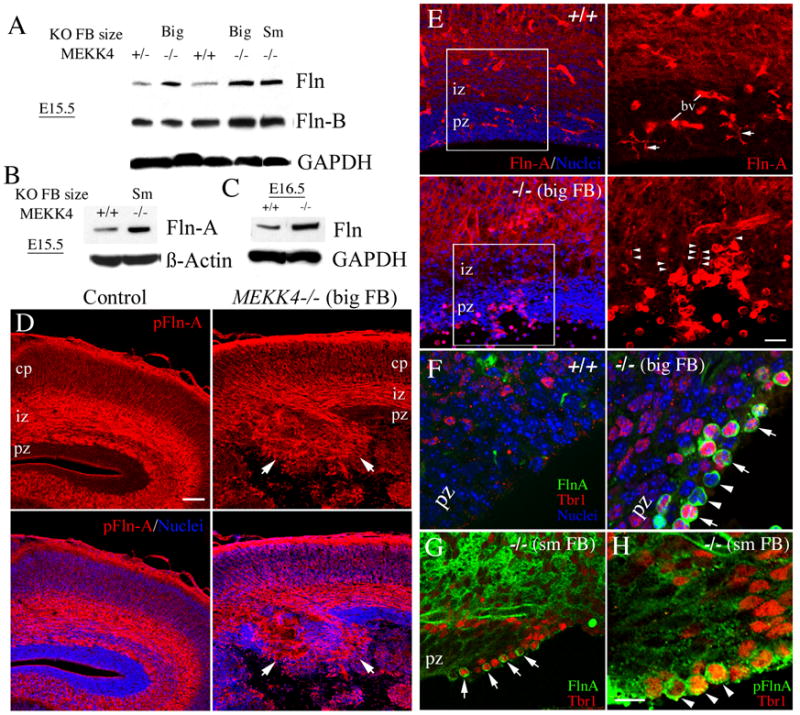
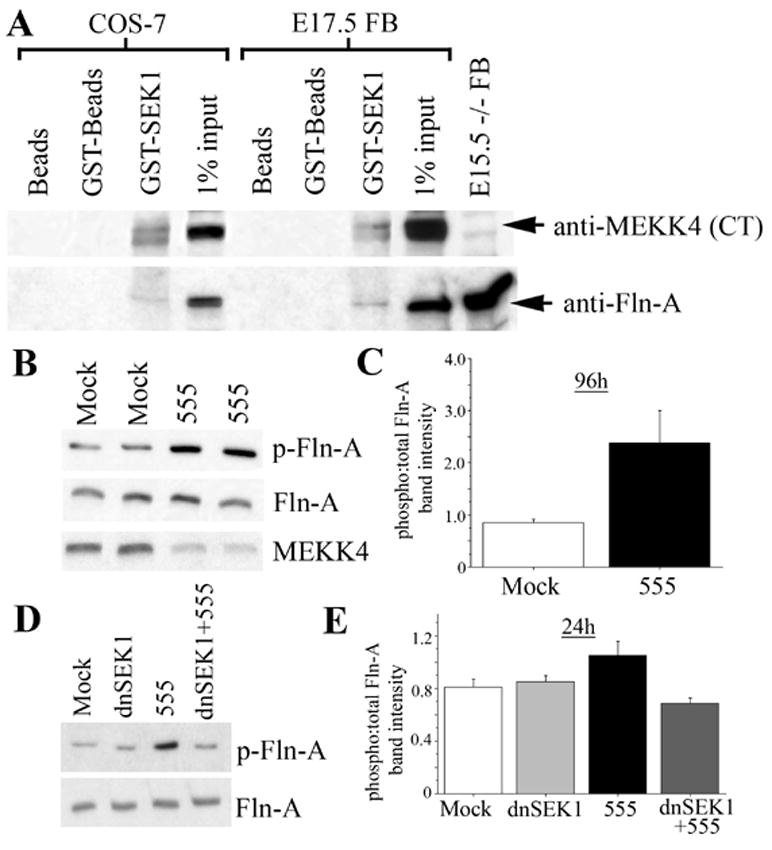
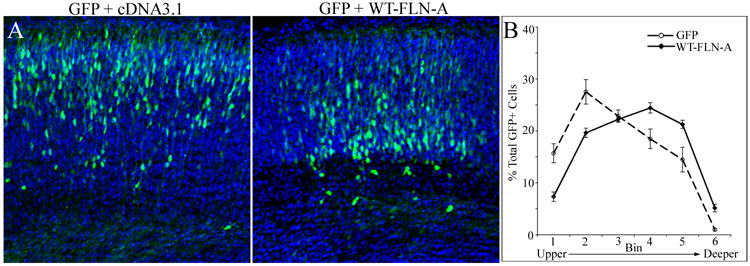
Periventricular heterotopia (PVH) is a congenital malformation of human cerebral cortex frequently associated with Filamin-A (FLN-A) mutations but the pathogenetic mechanisms remain unclear. Here, we show that the MEKK4 (MAP3K4) pathway is involved in Fln-A regulation and PVH formation. MEKK4(-/-) mice developed PVH associated with breaches in the neuroependymal lining which were largely comprised of neurons that failed to reach the cortical plate. RNA interference (RNAi) targeting MEKK4 also impaired neuronal migration. Expression of Fln was elevated in MEKK4(-/-) forebrain, most notably near sites of failed neuronal migration. Importantly, recombinant MKK4 protein precipitated a complex containing MEKK4 and Fln-A, and MKK4 mediated signaling between MEKK4 and Fln-A, suggesting that MKK4 may bridge these molecules during development. Finally, we showed that wild-type FLN-A overexpression inhibited neuronal migration. Collectively, our results demonstrate a link between MEKK4 and Fln-A that impacts neuronal migration initiation and provides insight into the pathogenesis of human PVH.


Figures

Figure 1
Figure 1. Cortical malformations in MEKK4−/− mice
(A) Nissl staining of E17.5 MEKK4+/+ and MEKK4−/− (big FB phenotype) coronal forebrain sections. Lower magnification (upper panels) revealed prominent bilateral PVH (arrows) that disrupted the continuity of the VZ/SVZ. Higher magnification of the telencephalic wall (lower panels) shows an example of a focal disruption of the VZ surface (arrows). Also observed was reduced thickness of the intermediate zone (IZ) in MEKK4−/− compared to control. The arrowhead points to a small subpial ectopia in the marginal zone (MZ) (arrowhead). Bars (μm) in A (upper)= 500, A (lower)=100. (B) Example of a large subpial ectopia (arrows) overlying a heterotopic area in MEKK4−/− big FB. Bar in B=100μm. (C) Example of polymicrogyria (arrows) overlying a heterotopic area in MEKK4−/− big FB. (D) GLAST immunoreactivity (green) and nuclear staining (blue) of MEKK4+/+ and −/− (big FB). Insets of boxed areas of nuclei (blue) show strong GLAST expression in control VZ (D1) compared to low expression in a PVH (D2, arrow) of the mutant. Bars (μm) in D = 100, D1 = 50. (E) TUJ1 immunoreactivity showed that PVH protruding into the lateral ventricle (LV) in MEKK4−/− big FB were TUJ1+ (arrows) compared to MEKK4+/+ (left panel) where the VZ lacked TUJ1. Propidium iodide (PI) was used to label nuclei (red). (F and G) TUJ1 immunoreactivity (green) and nuclei (red) in MEKK4−/− small FB phenotype. (F) Example of a PVH (arrow) that disrupted the VZ continuity and strongly expressed TUJ1. (G) An ectopia disrupting the pial surface that was was positive for TUJ1 and Tbr1 (G1). Bars in G, G1= 50μm. (H and I) Tbr1 immunoreactivity (red) and TO-PRO-3-labeled nuclei (blue) in MEKK4+/+ and −/− big FB. (H) Low magnification revealed many intensely labeled Tbr1+ cells in layer 6 of +/+ (left panel) and −/− (right panel). Note the numerous heavily labeled Tbr1+ cells (arrows) in −/− PVH. (I) High magnification of the VZ revealed a small cluster of Tbr1+ cells in the mutant VZ (right panels, arrows) compared to +/+ (left panels) where Tbr1 was normally absent. Bar= 50μm.
Figure 2
Figure 2. Failure of BrdU-positive cells to leave the ventricular surface and PVH in MEKK4-deficient forebrain
(A and B) Dams were exposed to BrdU at E14.5 and the forebrain (FB) was analyzed at E18.5. (A) Analysis of a PVH from a MEKK4−/− “big FB” phenotype stained for BrdU (green), TUJ1 (red) and TO-PRO-3 (blue). Compared to adjacent neocortex (asterisk), heavily labeled BrdU+ cells (arrows in BrdU) co-localized with TUJ1+ (arrows) in the PVH. (A1) Higher magnification of the boxed region in A shows heavily labeled BrdU+/TUJ1+ cells (arrows) within the heterotopia. Bars = 50μm. (B) Example of a MEKK4+/+ and MEKK4−/− with a “small FB” phenotype (sm FB) where BrdU+ cells (green) failed to leave the VZ surface compared to +/+. Nuclei were labeled with propidium iodide (red). Bar =100 μm.
Figure 3
Figure 3. MEKK4 siRNA impairs radial migration of neocortical neurons
(A, C, D and E) In utero electroporation was performed at E14.5 and forebrains were examined at P0. (A) Transfection with RFP alone (left) resulted in the majority of cells reaching the cortical plate (CP). In contrast, RFP+ cells co-transfected with siRNA#555 (arrows, right) were largely stuck in the corpus callosum (CC). Bar = 200μm. (B) Example of an E15.5 brain electroporated with siRNA#555SCR and GFP into the left hemisphere and siRNA#555 and RFP into the right hemisphere. At P0, siRNA#555 caused the majority of RFP+ cells to arrest in the CC whereas most GFP+ cells reached the CP. Bar= 50μm. (C) Quantification of the percentage of RFP+ cells in the proliferative zone (PZ), CC or CP from mice electroporated at E14.5 and sacrificed at P0. siRNA#555 (black bars) caused ~50% reduction of cells in the CP and significantly more cells to accumulate in the CC and PZ compared to RFP alone (white bars) or siRNA#555SCR (grey bars). *p<0.01 (ANOVA). (D) In utero electroporation of fetuses at E14.5, exposure of dams to BrdU at E15.5, and analysis at P0. Example of a brain electroporated with siRNA#555 shows a heterotopia (arrows) beneath the CP (ipsilateral) that contained many BrdU+ cells (arrows). In the ipsilateral area of CP (corresponding to the asterisk in lower panel) reduced BrdU immunostaining is observed over the heterotopia compared to the adjacent CP or opposite hemisphere (contralateral). Bar =100 μm. (E) Electroporation of pTα1-Venus-GFP alone (E1) or with siRNA#555 (E2–4) and immunostaining for GFP. (E1) Electroporation of pTα1-VenusGFP alone (−555) resulted in most GFP+ cells reaching the cortical plane (not visible in picture) with their axonal projections (arrow). (E2) Co-electroporation with siRNA#555 (+555) resulted in many GFP+ cells at the VZ surface. (E3 and E4) Higher magnifications of the boxed areas in E2 revealed cell bodies that remained at the VZ surface (arrowheads).
Figure 4
Figure 4. Defects along the ventricular and pial surface in MEKK4−/− brain
(A thru D) Laminin (green) and RC2 (red) immunostaining and TO-PRO-3-labeled nuclei (blue) in E17.5–18.5 wildtype (+/+) and MEKK4−/− small (sm) and big FB. (A) Laminin expression in +/+ was observed at the pial surface, blood vessels (bv) and along the VZ surface. (A1) RC2+ fibers appeared normal in +/+ connecting the VZ and pial surface. (A2) Higher magnification of the boxed region in A1 shows RC2+ radial glial endfeet and laminin coincided along the VZ surface. Bar in A (also for A1, B, B1 and D) = 50μm, A2 (also for B2, C, and D1)= 20μm. (B) Laminin staining in −/− sm FB showed an area of disrupted VZ labeling (arrows) at the site of a heterotopia. The lack of pial surface labeling was due to the meninges being separated away from the section. (B1) RC2+ fibers are disrupted at the heterotopic region (boxed area). (B2) Higher magnification of the boxed area in B1 shows abrupt ending of radial glial endfeet (arrowheads) that also corresponded to a lack of laminin immunoreactivity. (C) Discontinuous laminin staining (arrows) along the VZ surface in −/− big FB mutants. (D) An example of an ectopia in −/− sm FB that was associated with both a breech in the pial surface and extension of RC2+ fibers into the ectopia. (D1) Higher magnification of the boxed region in D shows disrupted pia label (large arrowhead) and extension of RC2+ fibers into the ectopia (small arrowheads). (E) Phalloidin-labeling of F-actin (green) revealed defects in the continuity of the adherens junctions complexes (aj) along the VZ surface in MEKK4−/− big FB (arrows in middle, right panels) compared to +/+. Nuclei (blue) appeared to be invading the ventricular space at these disrupted sites (arrows). Bars (μm) representing middle (and left) panel = 20 and right = 50.
Figure 5
Figure 5. Enhanced expression of Fln in MEKK4−/− forebrain
(A) E15.5 MEKK4+/+, +/− and −/− FB extracts. Compared to +/+ and +/−, MEKK4−/− with big or small FB had elevated Fln. For two of the MEKK4−/− (big and small (Sm) FB), probing the same blots with a FLN-B specific antibody showed that Fln consisted of elevated Fln-B. GAPDH was a loading control. (B) Western blot of E15.5 FB extract showed elevated Fln-A in a MEKK4−/− with a small FB. (C) Western blot of E16.5 FB showed elevated total Fln in the MEKK4−/−. β-actin was a loading control. (D) Immunostaining of E17.5 FB for phospho-Fln-A (pFln-A) using mAb(p2152FLN-A). In control, p-Fln-A was highly expressed in the IZ and CP compared to the MEKK4−/− where p-Fln-A persisted to the proliferative zone (PZ) surface at sites of PVHs (arrows). Bar = 100μm. (E) Immunostaining of Fln-A (mAb(4-4)) showed a similar pattern to pFln-A. Magnified views of Fln-A expression (red) from left hand panels are displayed to the right. In MEKK4+/+ (upper panels), Fln-A expression was low in the PZ and higher in the IZ. Microglia (arrows) and blood vessels (BV) were also labeled. In contrast, MEKK4−/− (big FB) ectopically showed areas of PZ that appeared highly positive for Fln-A. Lower panels show Fln-A positive cells with radially oriented fibers (arrowheads in magnified view) could be found within the PZ where the surface of the PZ was disrupted. Bar = 20μm. (F) Fln-A (green) and Tbr1 (red) immunostaining showed that in MEKK4−/− big FB mutants (right panel), heavily labeled Fln-A cells were both Tbr1+ (arrows) and Tbr1- (arrowheads). No Tbr1 was observed along the VZ surface in +/+ (left panel). (G) Example of Fln-A+/Tbr1+ (arrows) cells at the VZ surface in MEKK4−/− small FB. (H) An adjacent section to that in G showed Tbr1+ cells also stained for pFlnA (arrowheads). Bar= 10μm.
Figure 6
Figure 6. MEKK4 interaction and regulation of Fln-A phosphorylation via MKK4/SEK1
(A) Ten μg of GST-MKK4/SEK1 (GST-SEK1) was incubated in either ~500μg of COS-7 lysate or ~1mg E17.5 mouse forebrain (FB) lysate. As controls, equivalent amounts of COS-7 or FB lysates were incubated in glutathione-agarose beads (Beads) or beads pre-incubated in GST (GST-beads). One percent of lysates (1% input) were run for COS-7 or FB lysates. The upper blot was probed with anti-MEKK4 (CT) antibody and shows GST-MKK4/SEK1 precipitated endogenous MEKK4 in both COS-7 and FB lysate. Twenty μg of E15.5 MEKK4−/− FB lysate was run as a control. A doublet band is precipitated in both COS-7 and FB lysate with the upper band corresponding to MEKK4. The lower blot was probed using an anti-Fln-A antibody and showed that GST-MKK4/SEK1 also precipitated endogenous Fln-A from COS-7 and FB lysates. (B) NIH3T3 cells were mock or siRNA#555-transfected and cultured for 96h. Lysates (20μg/lane) from different mock and siRNA#555 (555)-transfected wells were western blotted and probed for phospho-Fln-A (Ser2152) (upper blot), Fln-A (middle blot), and MEKK4 (lower blot) antibodies. Increased phosphorylation of Fln-A was observed after transfection with siRNA#555. (C) The relative phospho- to total Fln-A band intensities were quantified for five separate transfections/group which showed increased Fln-A phosphorylation in siRNA#555-transfected cultures. (D) NIH3T3 cells were either untransfected (Mock) or transfected with dominant-negative SEK1 (dnSEK1), siRNA#555, or dnSEK1 plus siRNA#555. Lysates were collected at 24h, western blotted and probed as in C. The blot shows increased Fln-A phosphorylation (p-Fln-A) after siRNA#555 that was not observed when co-transfected with dnSEK1. (E) Quantification (as in C) of the results in D for at least 5–6 separate transfections/group. The enhanced Fln-A phosphorylation after siRNA#555 was blocked by co-transfection of dnSEK1.
Figure 7
Figure 7. FLN-A over-expression inhibits neuronal migration
(A) E14.5 cortex was electroporated with GFP and pcDNA3.1 vector (GFP +cDNA3.1) or GFP and pcDNA3.1 expressing full-length wild-type FLN-A (WT-FLN-A). After 96h, more GFP+ cells were observed in deeper CP of WT-FLN-A (right) compared to control (left). Nuclei (blue) were stained with DAPI. (B) Quantification of GFP+ cell distribution at 96h was determined by placing a grid (divided into six bins) spanning the upper and deeper CP and SP over the electroporated region. Significantly more GFP+ cells were located in the deeper CP and SP at 96h after WT-FLN-A (n=16 sections from 4 embryos) over-expression (solid) compared to GFP control (dashed) (n=12 sections from 3 embryos). Repeated Measures ANOVA (p<0.01).

Similar articles

Cited by

References

    1. Abell AN, Rivera-Perez JA, Cuevas BD, Uhlik MT, Sather S, Johnson NL, Minton SK, Lauder JM, Winter-Vann AM, Nakamura K, et al. Ablation of MEKK4 kinase activity causes neurulation and skeletal patterning defects in the mouse embryo. Mol Cell Biol. 2005;25:8948–8959. - PMC - PubMed
    1. Bachmann AS, Howard JP, Vogel CW. Actin-binding protein filamin A is displayed on the surface of human neuroblastoma cells. Cancer Sci 2006 - PMC - PubMed
    1. Bai J, Ramos RL, Ackman JB, Thomas AM, Lee RV, LoTurco JJ. RNAi reveals doublecortin is required for radial migration in rat neocortex. Nat Neurosci. 2003;6:1277–1283. - PubMed
    1. Bielas S, Higginbotham H, Koizumi H, Tanaka T, Gleeson JG. Cortical neuronal migration mutants suggest separate but intersecting pathways. Annu Rev Cell Dev Biol. 2004;20:593–618. - PubMed
    1. Calderwood DA, Huttenlocher A, Kiosses WB, Rose DM, Woodside DG, Schwartz MA, Ginsberg MH. Increased filamin binding to beta-integrin cytoplasmic domains inhibits cell migration. Nat Cell Biol. 2001;3:1060–1068. - PubMed

Publication types

MeSH terms