. 2007 Feb 16;282(7):4757-4764.
doi: 10.1074/jbc.M605248200. Epub 2006 Dec 4.

Molecular basis of Ca(v)2.3 calcium channels in rat nociceptive neurons

Affiliations

Molecular basis of Ca(v)2.3 calcium channels in rat nociceptive neurons

Zhi Fang et al. J Biol Chem. .

Abstract

Ca(v)2.3 calcium channels play an important role in pain transmission in peripheral sensory neurons. Six Ca(v)2.3 isoforms resulting from different combinations of three inserts (inserts I and II in the II-III loop and insert III in the carboxyl-terminal region) have been identified in different mammalian tissues. To date, however, Ca(v)2.3 isoforms unique to primary sensory neurons have not been identified. In this study, we determined Ca(v)2.3 isoforms expressed in the rat trigeminal ganglion neurons. Whole tissue reverse transcription (RT)-PCR analyses revealed that only two isoforms, Ca(v)2.3a and Ca(v)2.3e, are present in TG neurons. Using single cell RT-PCR, we found that Ca(v)2.3e is the major isoform, whereas Ca(v)2.3e expression is highly restricted to small (<16 mum) isolectin B4-negative and tyrosine kinase A-positive neurons. Ca(v)2.3e was also preferentially detected in neurons expressing the nociceptive marker, transient receptor potential vanilloid 1. Single cell RT-PCR following calcium imaging and whole-cell patch clamp recordings provided evidence of an association between an R-type calcium channel component and Ca(v)2.3e expression. Our results suggest that Ca(v)2.3e in sensory neurons may be a potential target for the treatment of pain.


Figures
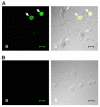
FIGURE 1
FIGURE 1. The representative photographs showing immunoreactivity of Cav2.3 in TG neurons
A, TG neurons visualized under FITC filter (panel a) and overlay with differential interference contrast (panel b). Cells with Cav2.3 immunoreactivity are shown by arrows; cells with no Cav2.3-immunoreactivity are shown by arrowheads. The expression of Cav2.3 is predominant in small TG neurons. B, TG neurons following preabsorption of the Cav2.3 primary antibody with its blocking peptide. Panel a, under FITC filter; panel b, differential interference contrast. The scale bar indicates 20 μm.
FIGURE 2
FIGURE 2
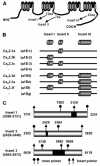
A, putative membrane topology of the Cav2.3 subunit. The structural variations include 19 (insert I) and 7 (insert II) amino acid (aa) segments in the loop between domains II and III and a 43-amino acid segment (insert III) in the proximal carboxyl terminus. B, eight possible isoforms deduced from the Cav2.3 sequence. Cav2.3a-Cav2.3f is a newly proposed set of names by Pereverzev et al. (20). The isoform names in parentheses are initial names. C, the illustration shows the locations in Cav2.3 subunit of the primers designed for RT-PCR analysis.
FIGURE 3
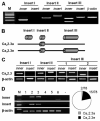
FIGURE 3. Two Cav2.3 isoforms were detected in TG neurons
A, inserts I–III were analyzed by whole tissue RT-PCR. The expected products sizes are as follows. Inner primer, Δinsert I (203 bp) and +insert I (260 bp); Δinsert II (259 bp) and +insert II (280 bp); Δinsert III (138 bp) and +insert III (267 bp); Insert primer, Δinsert I (no product) and +insert I (378 bp); Δinsert II (no product), and +insert II (392 bp); Δinsert III (no product) and +insert III (307 bp). The PCR products from TG neurons never have insert I, but always have insert II and either lack or contain insert III. B, illustrated are representative gels showing single cell RT-PCR products amplified using specific primers. Cav2.3 isoform that has insert II, but no insert I and III, corresponds to Cav2.3a. Cav2.3 isoform that has insert II and III, but no insert I, corresponds to Cav2.3e. C, single cell RT-PCR products amplified with nested primers from individual neurons were the same as PCR products from whole tissue, i.e. missing insert I, containing insert II, and either containing (lane 1) or missing (lane 2) insert III. Note that two PCR products with or without insert III (larger, lane 1 and smaller lane 2) were produced in different cells at single cell level, indicating that Cav2.3a and Cav2.3e are not expressed together in the same cells. D, the number (lanes 1–6) indicates six different neurons examined by single cell RT-PCR. β-Actin was used in each reaction as a positive control. This shows the proportion of TG neurons that contain Cav2.3e and Cav2.3a, respectively.
FIGURE 4
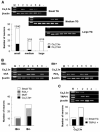
FIGURE 4. Distribution of Cav2.3e in nociceptive TG neurons
A, expression patterns of Cav2.3e were analyzed in three groups categorized according to TG neuron size (small, medium, and large). The representative gels show single cell RT-PCR products obtained from six (lanes 1–6) different neurons. Control β-actin was used in each single cell RT-PCR. The numbers of Cav2.3e-expressing neurons over total neurons tested are presented in the bar graph. B, distribution of Cav2.3e in small diameter sensory neurons. Illustrated are representative gels showing single cell RT-PCR products obtained from six (lanes 1–6) different neurons, IB4-negative and -positive TG neurons. After small diameter neurons in TG were classified as IB4-negative or IB4-positive neurons, trkA and P2X3 expression in each group was first determined by single cell RT-PCR. Then the expression pattern of Cav2.3e in each group was examined. The graph shows that Cav2.3e isoform expression was only restricted to IB4-negative/trkA-positive sensory neurons but not in IB4-positive neurons. C, illustrated are representative gels showing RT-PCR products amplified with Cav2.3e, TRPV1, and β-actin-specific primers from four different neurons. The graph shows that Cav2.3e is preferentially expressed in TRPV1-positive neurons.
FIGURE 5
FIGURE 5. Single cell RT-PCR analysis following fura-2 based calcium imaging
A, representative traces from an individual TG neuron obtained by subsequent application of high K+ solution (30 mm KCl) (●), which produced consistent responses upon triple application. B, Ca2+ transients obtained from depolarizing the TG neurons with high K+ solution was because ofCa2+ influx via calcium channels rather than mobilization of intracellular Ca2+ store. The pretreatment of thapsigargin failed to abolish high K+-induced calcium transients (n = 12, p > 0.01). The illustrated is a representative trace from a TG neuron. C, in a subpopulation of TG neurons (n = 9/15), calcium transient still remained in the presence of mixture solution of L-, N-, and P/Q-type blockers (bar); nimodipine, 500 nm; ω-CgTx, 500 nm; and ω-AgaIVA, 200 nm. This remaining calcium transients were completely blocked by application of CdCl2 (200 μm). This is a representative experiment. Single cell RT-PCR analysis following calcium imaging revealed Cav2.3e expression in the same cell (n = 5/9) but no Cav2.3a expression (n = 9/9). D, in the other TG neurons (n = 6/15), calcium transient was completely abolished by mixture solution. Neither Cav2.3e nor Cav2.3a mRNA was detected in these neurons (n = 6/6).
FIGURE 6
FIGURE 6. Single cell RT-PCR analysis following whole-cell patch clamp recordings
A, TG neurons acutely isolated from neonatal rats were visualized under fluorescence microscope (panel a) after IB4-FITC treatment prior to recording (panel b). Panel c, overlay. Arrowheads indicate IB4-negative cell; arrows indicate IB4-positive cell. B, in IB4-negative cells tested (n = 10), residual currents resulting from R-type calcium channel components remained in the presence of L-, N- and P/Q-type blockers (bar); nimodipine, 500 nm; ω-CgTx, 500 nm; and ω-AgaIVA, 200 nm. The residual currents were further blocked by the R-type calcium channel blocker SNX-482 (100 nm), and the calcium channel blocker CdCl2 (200 μm). Single cell RT-PCR analysis following recording revealed Cav2.3e expression in the same cell (n = 7/10) but no Cav2.3a expression (n = 10/10). C, in IB4-positve cells tested (n = 13), residual currents did not remain in some cells (a, n = 6) but remained in the other cells (b, n = 7). Neither the Cav2.3e nor Cav2.3a transcript was detected in these neurons (n = 13).

Similar articles

Cited by

References

    1. Sessle BJ. J. Dent. Educ. 2002;66:108–112. - PubMed
    1. Ji RR, Woolf CJ. Neurobiol. Dis. 2001;8:1–10. - PubMed
    1. Vanegas H, Schaible H. Pain. 2000;85:9–18. - PubMed
    1. Yaksh TL. J. Pain. 2006;7(Suppl 1):13–30. - PubMed
    1. Catterall WA. Annu. Rev. Cell Dev. Biol. 2000;16:521–555. - PubMed

Publication types

MeSH terms

LinkOut - more resources