. 2006 Dec 25;203(13):2887-93.
doi: 10.1084/jem.20061519. Epub 2006 Dec 4.

APOBEC3G/3F mediates intrinsic resistance of monocyte-derived dendritic cells to HIV-1 infection

Affiliations

APOBEC3G/3F mediates intrinsic resistance of monocyte-derived dendritic cells to HIV-1 infection

Marjorie Pion et al. J Exp Med. .

Abstract

HIV-1 infects immature dendritic cells (iDCs), but infection is inefficient compared with activated CD4+ T cells and only involves a small subset of iDCs. We analyzed whether this could be attributed to specific cellular restrictions during the viral life cycle. To study env-independent restriction to HIV-1 infection, we used a single-round infection assay with HIV-1 pseudotyped with vesicular stomatitis virus G protein (HIV-VSVG). Small interfering RNA-mediated depletion of APOBEC3G/3F (A3G/3F), but not TRIM5alpha, enhanced HIV-1 infection of iDCs, indicating that A3G/3F controls the sensitivity of iDCs to HIV-1 infection. Furthermore, sequences of HIV reverse transcripts revealed G-to-A hypermutation of HIV genomes during iDC infection, demonstrating A3G/3F cytidine deaminase activity in iDCs. When we separated the fraction of iDCs that was susceptible to HIV, we found the cells to be deficient in A3G messenger RNA and protein. We also noted that during DC maturation, which further reduces susceptibility to infection, A3G levels increased. These findings highlight a role for A3G/3F in explaining the resistance of most DCs to HIV-1 infection, as well as the susceptibility of a fraction of iDCs. An increase in the A3G/3F-mediated intrinsic resistance of iDCs could result in a block of HIV infection at its mucosal point of entry.


Figures

Figure 1.
Figure 1.
HIV-1 infection is restricted in iDCs. (A) Infection of iDCs and JTs with full-length HIV-1 vector encoding GFP and pseudotyped with VSVG (HIV-VSVG; MOI = 1). GFP expression was followed by FACS after 3 d of infection. One representative experiment out of two is shown. (B) iDCs and JTs were infected with a multiply deleted LV encoding GFP pseudotyped with VSVG (LV-VSVG; MOI = 1). One representative experiment out of two is shown. Boxes in A and B indicate that GFP+ cells are in that gate. (C) Infection of iDCs or Jurkat cells with increasing amounts of LV-VSVG (open symbols) or HIV-VSVG (closed symbols; MOI = 0.01–10). One representative experiment out of two is shown. ▪ and □, GFP expression in JTs; ▴ and ▵, GFP expression in iDCs.
Figure 2.
Figure 2.
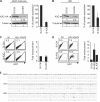
A3G restricts HIV-1 infection in iDC 293T. A3G-HA cells (A) or iDCs (B) were transfected with siRNA against A3G (Si-A3G) or siRNA control (Si-Ctrl). After two rounds of transfection, cells were analyzed by Western blot (A and B, left). The percentage of protein expression on Western blot was quantified by density of specific bands and normalized with Si-Ctrl (A and B, right). 293T-A3G-HA cells (C) or iDCs (D) transfected by Si-A3G and Si-Ctrl were infected with HIV-VSVG. GFP expression was followed by FACS (numbers are the percentage of GFP+ cells; C and D, left), and the fold enhancement of GFP expression was calculated by normalization with nontreated (NT) cells (C and D, right). A pool of five independent experiments is shown for A3G (±SEM), and two independent experiments are shown for A3F (±SEM). NI, noninfected. (E) A3G/3F induce G-to-A hypermutation of HIV genomes during iDC infection. Sequences represent individual HIV-1 reverse transcripts obtained after an 8-h infection of iDCs and are representative of the 7 hypermutated sequences (17%) that were obtained among 40 reverse transcripts. The standard HIV NL4.3 numbering is used.
Figure 3.
Figure 3.
Human T5α does not restrict HIV-1 infection in iDCs. HeLa-T5α-HA cells (A and B, left) or iDCs (A and B, right) were transfected with siRNA against T5α (Si-T5α) or siRNA control (Si-Ctrl). After two rounds of transfection, the cells were lysed and analyzed by Western blot (A). The percentage of protein expression on Western blot was quantified by the density of specific bands and normalized with Si-Ctrl (B). HeLa-T5α-HA (C and D, left) or iDC (C and D, right) knockdowns for T5α were infected with MLV-GFP or HIV-VSVG. GFP expression was followed by FACS (C), and the fold enhancement of GFP expression was calculated by normalization with cells treated with Si-Ctrl. Boxes indicate the percentage of GFP+ cells. (D). Results are a pool of three independent experiments (±SD). MLV, murine leukemia virus.
Figure 4.
Figure 4.
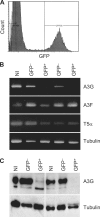
HIV-VSVG infects iDCs that express low levels of A3G. (A) iDCs were infected with HIV-VSVG and sorted after 5 d as GFP+ (infected) and GFP (noninfected) fractions. (B) RNA was extracted and subjected to RT-PCR for A3G (30 cycles), A3F (35 cycles), T5α (35 cycles), and tubulin. (C) Proteins extracted from the same cells were used in Western blot for A3G and tubulin. The figure shows two different cell preparations. NI, uninfected control cells.
Figure 5.
Figure 5.
DC maturation increases A3G levels and further restricts HIV-1 infection. (A) Infection of iDCs and mDCs with HIV-VSVG. DCs were infected with increasing amounts of HIV-VSVG. GFP expression was followed by FACS after 3 d of infection. One representative experiment out of two is shown. (B) Analysis of A3G expression in iDCs, mDCs, 293T-A3G-HA cells, and HeLa cells by Western blot. (C) DCs contain A3G in the SN fraction (A3G SN). Control cells (top) and primary cells (bottom) were lysed and centrifuged at high speed. Equal volumes of P and SN fractions were analyzed by Western blotting. Numbers represent the amount of A3G in SN and P; A3G expression in SN was quantified, with a value of 1 assigned to the P. One representative experiment out of three is shown. (D) A3G SN correlates with restriction to HIV infection in DCs. Single-round infection experiments were performed with a VSVG-pseudotyped HIV-GFP virus. GFP+ cells were evaluated by FACS 3 d after infection. Infectivity of the different cell types is represented: high (+++), >75%; moderate (++), 40–50%; low, (+/−) <10–15%; very low (+/−−), <5%; none (−); and not determined (ND). One representative experiment out of three is shown (±SD).

Similar articles

Cited by

References

    1. Piguet, V., and A. Blauvelt. 2002. Essential roles for dendritic cells in the pathogenesis and potential treatment of HIV disease. J. Invest. Dermatol. 119:365–369. - PubMed
    1. Steinman, R.M., A. Granelli-Piperno, M. Pope, C. Trumpfheller, R. Ignatius, G. Arrode, P. Racz, and K. Tenner-Racz. 2003. The interaction of immunodeficiency viruses with dendritic cells. Curr. Top. Microbiol. Immunol. 276:1–30. - PubMed
    1. Margolis, L., and R. Shattock. 2006. Selective transmission of CCR5-utilizing HIV-1: the ‘gatekeeper’ problem resolved? Nat. Rev. Microbiol. 4:312–317. - PubMed
    1. Pope, M., S. Gezelter, N. Gallo, L. Hoffman, and R.M. Steinman. 1995. Low levels of HIV-1 infection in cutaneous dendritic cells promote extensive viral replication upon binding to memory CD4+ T cells. J. Exp. Med. 182:2045–2056. - PMC - PubMed
    1. Granelli-Piperno, A., E. Delgado, V. Finkel, W. Paxton, and R.M. Steinman. 1998. Immature dendritic cells selectively replicate macrophagetropic (M-tropic) human immunodeficiency virus type 1, while mature cells efficiently transmit both M- and T-tropic virus to T cells. J. Virol. 72:2733–2737. - PMC - PubMed

Publication types

MeSH terms