. 2006 Dec;4(12):e435.
doi: 10.1371/journal.pbio.0040435.

Plasma membrane is the site of productive HIV-1 particle assembly

Affiliations

Plasma membrane is the site of productive HIV-1 particle assembly

Nolwenn Jouvenet et al. PLoS Biol. 2006 Dec.

Erratum in

Abstract

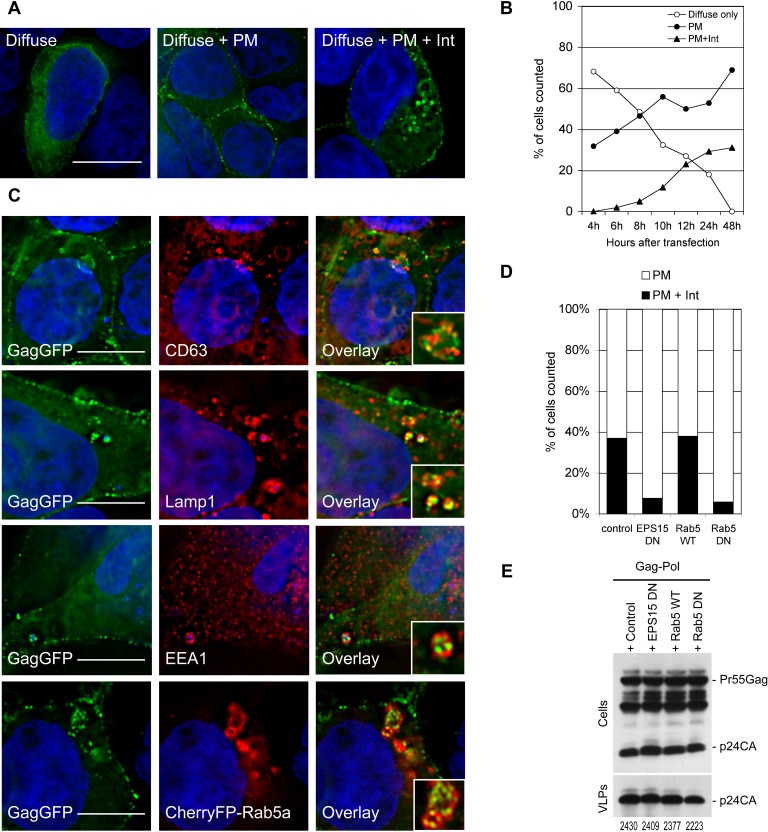
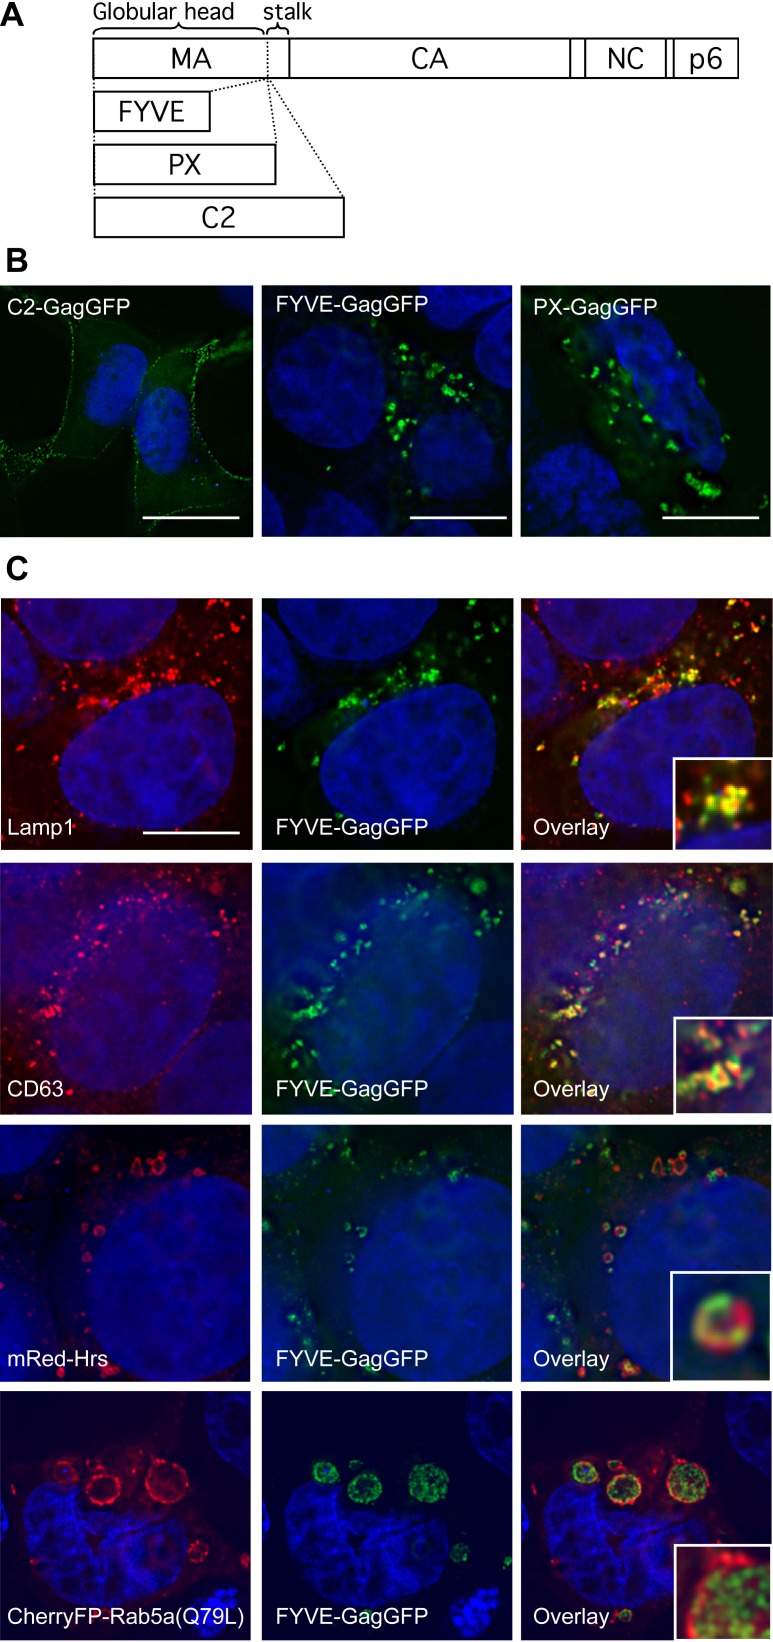
Recently proposed models that have gained wide acceptance posit that HIV-1 virion morphogenesis is initiated by targeting the major structural protein (Gag) to late endosomal membranes. Thereafter, late endosome-based secretory pathways are thought to deliver Gag or assembled virions to the plasma membrane (PM) and extracellular milieu. We present several findings that are inconsistent with this model. Specifically, we demonstrate that HIV-1 Gag is delivered to the PM, and virions are efficiently released into the extracellular medium, when late endosome motility is abolished. Furthermore, we show that HIV-1 virions are efficiently released when assembly is rationally targeted to the PM, but not when targeted to late endosomes. Recently synthesized Gag first accumulates and assembles at the PM, but a proportion is subsequently internalized via endocytosis or phagocytosis, thus accounting for observations of endosomal localization. We conclude that HIV-1 assembly is initiated and completed at the PM, and not at endosomal membranes.


Conflict of interest statement

The authors have declared that no competing interests exist.

Figures

Figure 1
Figure 1. Efficient HIV-1 Particle Formation in the Absence of Microtubules
(A and B) Western blot analysis of 293T cells expressing HIV-1 Gag-Pol in the absence (A) or presence (B) of nocodazole, added immediately after transfection. Samples were collected every hour, as indicated, and cell and virion lysates were probed with anti–HIV-1 CA antibodies. Numerical values below the blots indicate VLP p24CA signal intensities, derived by densitometry; absence of a value indicates undetectable signal. (C) 293T cells expressing Gag-GFP (green) in the absence or presence of nocodazole were fixed 14-h post-transfection. Samples were stained with anti–α-tubulin antibodies (red) and with Hoechst 33258 (blue). Scale bars indicate 8 μm. (D) 293T cells expressing VSV-G in the absence or presence of nocodazole were fixed 14-h post-transfection. Samples were stained with anti–VSV-G antibodies (green) and with Hoechst 33258 (blue). Scale bar indicates 8 μm.
Figure 2
Figure 2. Efficient HIV-1 Particle Formation Does Not Require Late Endosome Motility
(A) U18666A induces the collapse of late, but not early, endosomes toward a perinuclear region of 293T cells. Cells treated with U18666A or DMSO for 14 h were fixed and stained with anti-Lamp1 or anti-EEA1 antibodies (red) and Hoechst 33258 (blue). Scale bars indicate 8 μm. (B) 293T cells expressing Gag-GFP (green) in the presence or absence of U18666A, which was added immediately after transfection. Samples were fixed at 14-h post-transfection and stained with Hoechst 33258 (blue). Scale bar indicates 4 μm. (C) Western blot analysis of 293T cells expressing Gag-Pol in the absence or presence of U18666A, which was added immediately after transfection. Samples were collected and analyzed as in Figure 1A. Numerical values below the blots indicate VLP p24CA signal intensities, derived by densitometry; absence of a value indicates undetectable signal.
Figure 3
Figure 3. Accumulation of Gag at the PM Precedes Endosomal Accumulation, Which Can Be Prevented by Blocking Endocytosis
(A) Distribution of Gag-GFP in 293T cells at 24-h post-transfection. Examples of cells exhibiting diffuse Gag only (left), PM accumulations (center), or PM + internal (Int; right) accumulations are shown. Samples were stained with Hoechst 33258 (blue). Scale bars indicate 4 μm. (B) Quantification of Gag-GFP distribution in 293T cells. The number of cells in which Gag-GFP accumulation was observed at the PM, as internal and PM accumulations, or as a diffuse cytoplasmic signal only was counted. Approximately 100 cells were evaluated at each time point. (C) Gag-GFP accumulates at both early and late endosomes. 293T cells expressing Gag-GFP (green) were fixed at 24-h post-transfection and stained with anti-CD63, anti-Lamp1, or anti-EEA1 antibodies (red). Alternatively, cells were co-transfected with CherryFP-Rab5a (red). Cells were stained with Hoechst 33258 (blue). Insets show expanded views of individual Gag puncta. Scale bars, from top to bottom, indicate 4 μm, 2 μm, 8 μm, and 2 μm. (D) Quantification of Gag-GFP distribution in 293T in the presence of endocytosis inhibitors. 293T cells expressing Gag-GFP together with the indicated proteins were fixed at 24-h post-transfection and the proportion of cells (out of 100 counted) in which Gag was found at the PM, or both at internal accumulations and at the PM was determined. (E) Western blot analysis of 293T cells expressing HIV-1 Gag-Pol in the presence of endocytosis inhibitors. Samples were collected at 24-h post-transfection as indicated, and cell and virion lysates were probed with anti-HIV-1 CA antibodies. Numerical values below the blots indicate VLP p24CA signal intensities, derived by densitometry.
Figure 4
Figure 4. Retargeting HIV-1 Gag to Endosomes
(A) Schematic representation of retargeted Gag proteins in which the globular head of matrix is replaced by specific membrane-binding domains. (B) Distribution of retargeted Gag proteins in 293T cells. Cells expressing FYVE-Gag-GFP, PX-Gag-GFP, or C2-Gag-GFP (green) were fixed at 24-h post-transfection. Scale bars indicate 8 μm (left panel) or 4 μm (center and right panels). (C) FYVE-Gag-GFP targets late endosomes. 293T cells expressing FYVE-Gag-GFP (green) were fixed at 24-h post-transfection and stained with anti–Lamp-1 or anti-CD63 antibodies (red). Alternatively, cells were co-transfected with mRed-Hrs or CherryFP-Rab5aQ79L (red). Insets show expanded views of individual FYVE-Gag-GFP accumulations. Scale bars indicate 4 μm.
Figure 5
Figure 5. HIV-1 Particles Are Not Released When Assembly Is Targeted to Endosomes
(A) Electron microscopy analysis of 293T cells expressing CherryFP-Rab5aQ79L together with WT-Gag-Pol (left), in which a portion of the PM is shown, or FYVE-Gag-Pol (right), in which mature virions and assembly intermediates are found in intracellular vesicles. Scale bars indicate 200 nm. (B) Western blot analysis of 293T cells expressing WT (wild type) or retargeted Gag-Pol or Gag-GFP proteins. Samples were collected at 24-h post-transfection. Cell and virion lysates were probed with anti–HIV-1 CA antibodies. Numerical values below the blots indicate VLP Gag-GFP or p24CA signal intensities, derived by densitometry. (C) Infectivity measurements using supernatant collected from 293T cells expressing WT, G2A mutant, or retargeted Gag-Pol proteins along with a packageable HIV-1 GFP expression vector and VSV-G. The percentage of infected (GFP+) TE671 target cells is plotted as a function of inoculum volume.
Figure 6
Figure 6. HIV-1 Gag Accumulation at the PM Precedes Accumulation in Primary Human Macrophage Endosomes
(A) Distribution of Gag-GFP in macrophages. Cells expressing Gag-GFP (green) were fixed at 24-h post-transfection and stained with Hoechst 33258 (blue). Examples of cells exhibiting diffuse Gag only (left), PM accumulations (center), or PM + internal (Int; right) accumulations are shown. Insets show individual Gag-GFP puncta at the PM coverslip interface. Scale bar indicates 10 μm. (B) Western blot analysis of macrophages expressing Gag-GFP. Samples were collected every 2 h, from 4- to 12-h post-transfection. Cell and extracellular particle lysates were probed with anti–HIV-1 CA antibodies. Numerical values below the blots indicate VLP signal intensities, derived by densitometry. (C) Quantification of Gag-GFP distribution in macrophages. The proportion of cells (of 100 counted at each time point) in which Gag-GFP was observed in accumulations only at the PM, as internal and PM accumulations, or as a diffuse cytoplasmic signal only were counted. (D) Intracellular Gag-GFP is observed on early and late endosomes in macrophages. Cells expressing Gag-GFP (green) were fixed at 24-h post-transfection and stained with anti-EEA1 (red). Alternatively, cells were co-transfected with mRed-Hrs (red). Inset in the bottom right panel shows an individual EEA1+ endosome and associated Gag-GFP. Scale bars indicate 10 μm (top panel) and 4 μm (bottom panel).
Figure 7
Figure 7. HIV-1 Assembly Does Not Required Microtubules or Endosome Motility in Primary Human Macrophages
(A) Macrophages expressing Gag-GFP were treated with nocodazole or U18666A for the entire duration of Gag-GFP synthesis. Cells were fixed at 12-h post-transfection and stained with Hoechst 33258 (blue). Scale bars indicate 10 μm. (B) Western blot analysis of macrophages expressing Gag-GFP in the presence of DMSO, nocodazole, or U18666A. Samples were collected every 2 h, from 4- to 12-h post-transfection. Cell and virion lysates were probed with anti–HIV-1 CA antibodies. Numerical values below the blots indicate VLP signal intensities, derived by densitometry.
Figure 8
Figure 8. Late Endosomes Are Not Productive Sites of HIV-1 Particle Formation in Primary Human Macrophages
(A) Distribution of retargeted Gag-GFP proteins in macrophages. Cells expressing C2-Gag-GFP, FYVE-Gag-GFP, or PX-Gag-GFP (green) were fixed at 24-h post-transfection. Scale bars indicate 10 μm. (B) FYVE-Gag-CherryFP targets late endosomes. Macrophages expressing FYVE-Gag-CherryFP (red) and CD63-GFP or Lamp1-GFP (green) were fixed at 24-h post-transfection and stained with Hoechst 33258 (blue). Insets are expanded views of individual accumulations of FYVE-Gag-CherryFP. Scale bar indicates 10 μm. (C) Western blot analysis of macrophages expressing Gag-GFP WT or mutants. Samples were collected at 24-h post-transfection. Cell and virion lysates were probed with anti–HIV-1 CA antibodies. Numerical values below the blots indicate VLP signal intensities, derived by densitometry.
Figure 9
Figure 9. Actin Influences HIV-1 Gag Localization but Not Particle Release in Primary Human Macrophages
(A) Disruption of microfilaments in macrophages. Macrophages treated with DMSO or cytochalasin-D were fixed 12 h after treatment and stained with phalloidin (red) and Hoechst 33258 (blue). Scale bars indicate 20 μm. (B) Western blot analysis of macrophages expressing Gag-GFP in the presence of DMSO or cytochalasin-D. Samples were collected every 2 h, from 4- to 12-h post-transfection. Cell and virion lysates were probed with anti–HIV-1 CA antibodies. Numerical values below the blots indicate VLP signal intensities, derived by densitometry. (C) Quantification of Gag-GFP distribution in macrophages in the absence of microfilaments. Macrophages expressing Gag-GFP were treated with DMSO or cytochalasin D for the entire duration of Gag-GFP synthesis. Cells were fixed at 12-h post-transfection, and the proportion of cells (of 100 counted) in which Gag was found at the PM, or at both internal sites and the PM was counted.
Figure 10
Figure 10. Actin Influences HIV-1 Gag Localization but Not Particle Release in Infected Macrophages
(A) Immunofluorescent detection of HIV-1 CA in macrophages, 38 h after infection by pseudotyped NL4–3 (Env). Deconvolved optical sections acquired at the center of the vertical dimension of the cell, and at the cell–coverslip interface are shown for examples of infected cells cultured in the presence of DMSO or cytochalasin D. Cells were stained with anti–HIV-1 CA antibodies (red) and Hoechst 33258 (blue). Inset shows expanded view at the PM–coverslip interface and individual Gag puncta. Scale bar indicates 10 μm. (B) Quantitative analysis of Gag localization in NL4–3 (Env) infected macrophages. The proportion of cells exhibiting each Gag distribution among 44 to 49 cells counted is plotted. (C) Distribution of Gag in NL4–3 (MA/YFP) infected macrophages, as in (A) except that no immunostaining was done. Inset shows expanded view at the PM–coverslip interface and individual Gag (MA/YFP) puncta. Scale bar indicates 10 μm. (D) Western blot analysis of HIV-1 release from NL4–3 (Env) infected cells in the presence or absence of cytochalasin D, as indicated. Numerical values below the blots indicate p24CA signal intensities in cells and VLPs, derived by densitometry.

Comment in

References

    1. Gottlinger HG. The HIV-1 assembly machine. AIDS. 2001;15(Suppl 5):S13–20. - PubMed
    1. Bieniasz PD. Late budding domains and host proteins in enveloped virus release. Virology. 2006;344:55–63. - PubMed
    1. Morita E, Sundquist WI. Retrovirus budding. Annu Rev Cell Dev Biol. 2004;20:395–425. - PubMed
    1. Pelchen-Matthews A, Kramer B, Marsh M. Infectious HIV-1 assembles in late endosomes in primary macrophages. J Cell Biol. 2003;162:443–455. - PMC - PubMed
    1. Raposo G, Moore M, Innes D, Leijendekker R, Leigh-Brown A, et al. Human macrophages accumulate HIV-1 particles in MHC II compartments. Traffic. 2002;3:718–729. - PubMed

Publication types

MeSH terms