

doi: 10.1186/gb-2006-7-11-120.
How complete are current yeast and human protein-interaction networks?
Affiliations
- PMID: 17147767
- PMCID: PMC1794583
- DOI: 10.1186/gb-2006-7-11-120
Item in Clipboard
How complete are current yeast and human protein-interaction networks?
Genome Biol.
2006.
Abstract
We estimate the full yeast protein-protein interaction network to contain 37,800-75,500 interactions and the human network 154,000-369,000, but owing to a high false-positive rate, current maps are roughly only 50% and 10% complete, respectively. Paradoxically, releasing raw, unfiltered assay data might help separate true from false interactions.
Figures
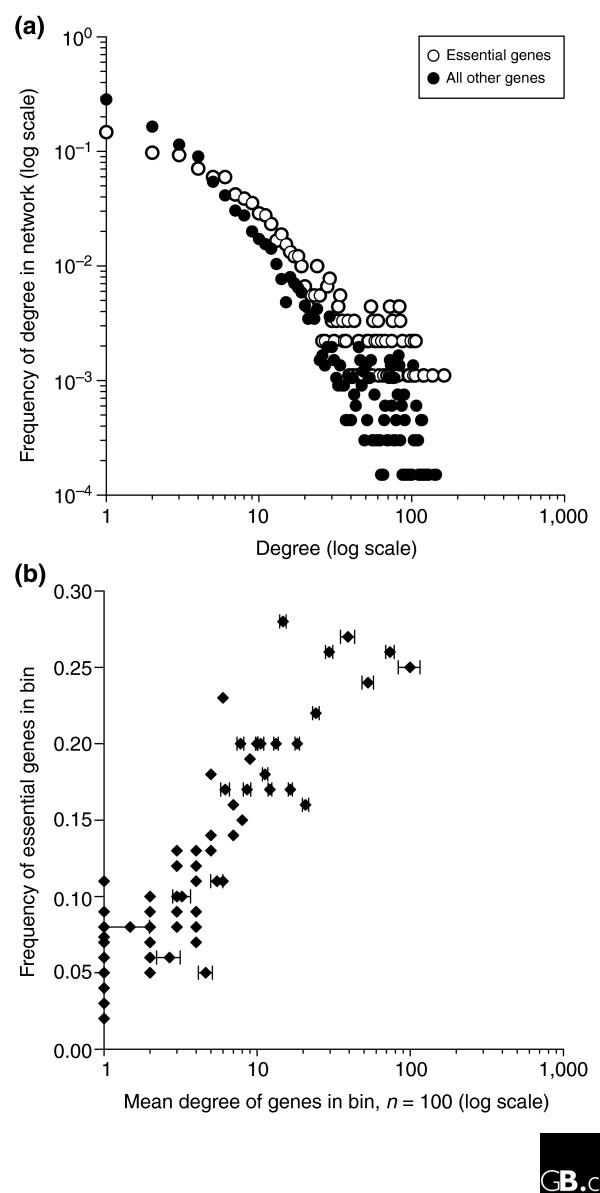
The tendency for a human gene to be essential correlates well with the number of its protein-interaction partners, suggesting that essential human genes can be identified directly from protein-interaction networks. (a) For a set of around 31,000 human protein interactions [49], the number of interactions per protein (the 'degree') is plotted for 907 essential vertebrate proteins known from mouse knockouts [50], human small interfering (si)RNA screens [51,52], and zebrafish random mutagenesis [53] and for the remaining 6,661 proteins in the network, considering only the largest connected network component. (b) The likelihood of being essential increases with increasing degree. Proteins were sorted by degree and divided into bins of 100 proteins each (filled diamonds). The observed frequency of essential genes in the bin is plotted against the average degree of the proteins in the bin, showing high correlation (R2 = 0.78) between degree and essentiality.
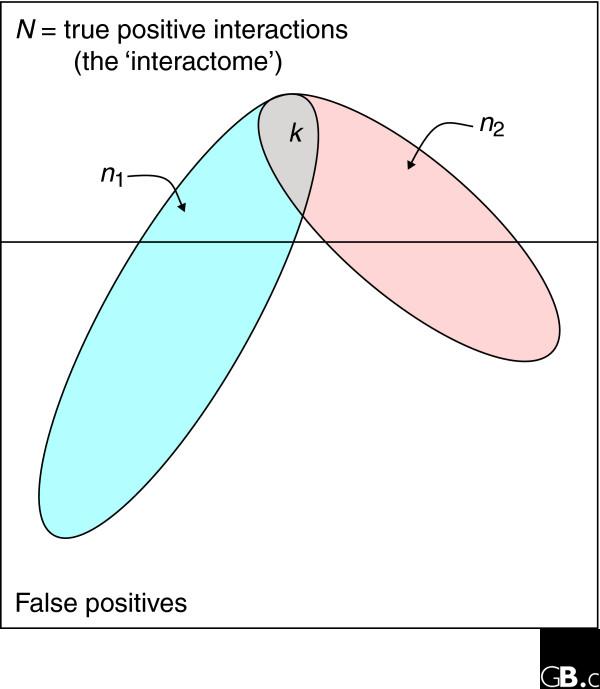
The method of intersection analysis for estimating interactome size. In an interactome, or subspace of an interactome, of N true interactions, two independent assays of n1 and n2 interactions are expected, under the hypergeometric distribution, to share k interactions by random chance. As described in the text, we can use the observed intersection of interaction assays to estimate N.
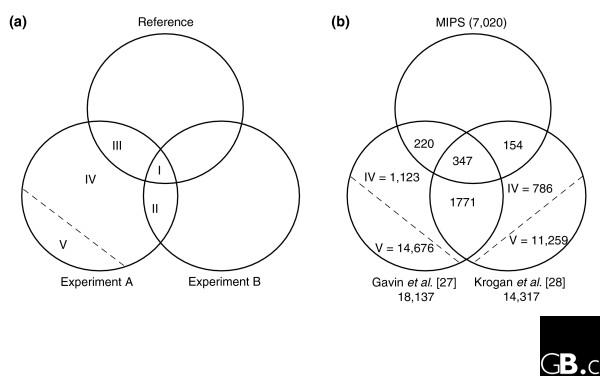
Estimating false-positive rates of large-scale assays. (a) As described by D'haeseleer and Church [32], the number of true positives in an interaction dataset can be estimated by examining the ratio of intersections of two similar datasets (A and B) and a reference dataset. If intersections contain all true positives, then the ratio of areas I and II is equal to the ratio of areas III and IV, where IV contains true positives (and V false positives, not shown to scale). The number of false positives can then be determined by simple subtraction, repeating the calculation for the other dataset. (b) Calculation of false-positive rates for the most recent yeast mass spectrometry assays of Gavin et al. [27] and Krogan et al. [28] within the interactome subspace sampled by both experiments (1,243 baits) and using MIPS as the reference sample [33]. Intersections (regions I, II, II) were determined by examining the data, and true- and false-positive populations (regions IV and V) were calculated as described in (a).
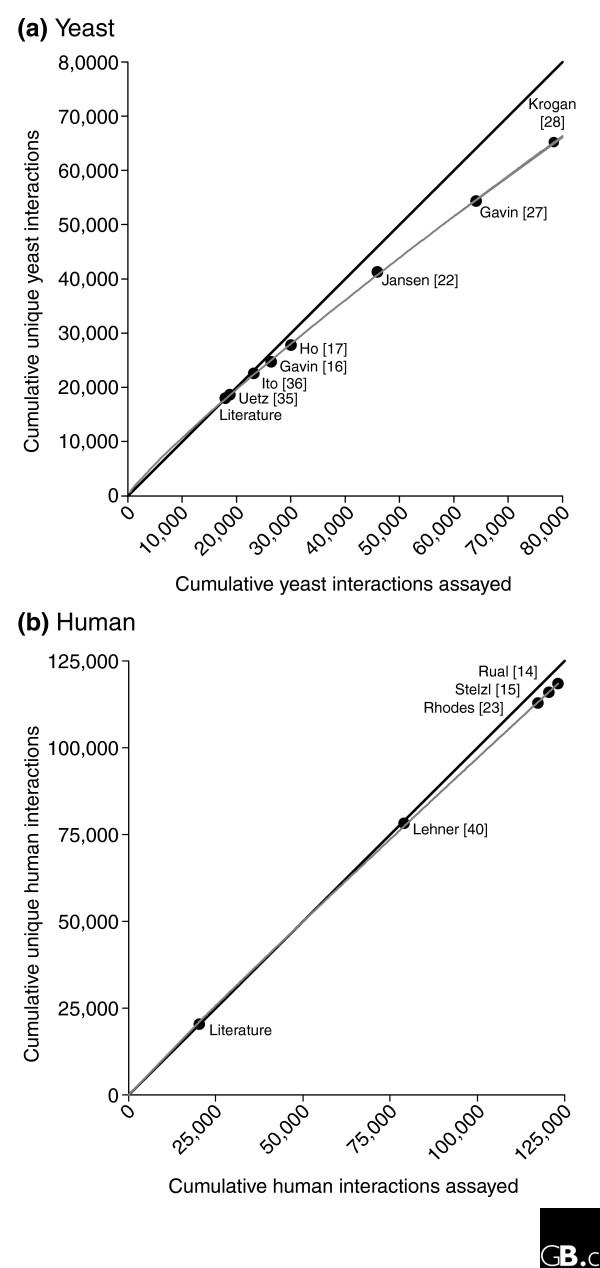
Comparison of the degree of completion of the yeast and human protein-interaction networks. Neither (a) the yeast nor (b) the human protein-interaction network is near completion as judged by the extent of assay saturation for the studies indicated here, although the yeast network shows higher saturation. With repeating assays on a finite set of interactions, we expect the rate of discovery of new interactions (gray line) to fall below 100% (black diagonal line) and asymptotically to approach the false-positive discovery rate. If false-positive rates are properly controlled, the rate of new interactions should level out, indicating the complete network assayable by these methods. In yeast, the most recent mass spectrometry study of Krogan et al. [28] (core set) shows 66% new interactions, suggesting initial saturation. Human protein interactions are under-sampled; the most recent study, Rual et al. [14], assayed 95% new interactions.
References
MeSH terms
Substances
LinkOut - more resources
Full Text Sources
Other Literature Sources
Molecular Biology Databases
